
Introduction
In this post, I’ll walk through my deployment of LibreNMS (https://www.librenms.org/) within my lab environment. LibreNMS is a widely adopted, open-source, SNMP-based network and service monitoring platform designed to provide centralized visibility into the health, performance, and availability of infrastructure devices.
By leveraging SNMP polling and time-series data collection, LibreNMS allows me to monitor a wide range of systems from a single dashboard, including switches, firewalls, servers, printers, hypervisors, and out-of-band management interfaces. This centralized approach makes it easier to understand how the lab is performing as a whole, quickly identify issues, and analyze trends over time.
Deploying LibreNMS in the lab not only improves day-to-day operational awareness, but also mirrors the type of monitoring architecture commonly found in enterprise NOC and SOC environments, making it a valuable learning and experimentation platform.
What Is SNMP?
Simple Network Management Protocol (SNMP) is a widely used network management protocol designed to collect operational and performance data from network-connected devices such as switches, routers, firewalls, servers, printers, and embedded systems.
SNMP operates on a manager/agent model:
- A management system (such as LibreNMS) acts as the SNMP manager.
- Each monitored device runs an SNMP agent that exposes metrics and status information.
Devices expose this data through a structured hierarchy called a Management Information Base (MIB), which defines counters, sensors, and system attributes such as interface traffic, CPU utilization, memory usage, temperatures, and uptime.
SNMP typically uses UDP port 161 for polling (GET/GETNEXT/GETBULK requests) and UDP port 162 for asynchronous traps and notifications sent from devices back to the monitoring system.
Common SNMP versions include:
- SNMP v2c – Simple and widely supported, using a shared community string for access control.
- SNMP v3 – Adds authentication, encryption, and user-based security, making it suitable for more security-sensitive environments.
Because of its lightweight design and broad vendor support, SNMP remains one of the most effective and scalable ways to monitor the health and performance of network and infrastructure devices.
Deployment Overview
LibreNMS was deployed on a dedicated Proxmox virtual machine running Ubuntu Server 24.04 LTS, with the entire application stack containerized using Docker and Docker Compose. This deployment model provides a clean separation of concerns, simplifies upgrades, and makes the platform easy to maintain and scale as the lab continues to grow.
Once the LibreNMS platform was online, I configured SNMP across the lab’s network and infrastructure devices, enabling them to report health, performance, and availability metrics back to the monitoring system. Depending on device capabilities and security requirements, I used SNMP v2c or SNMP v3, balancing broad compatibility with secure, authenticated monitoring. Devices currently monitored include switches, firewalls, servers, hypervisors, and out-of-band management interfaces.
Installing LibreNMS
I chose to deploy LibreNMS using the official containerized application stack provided by the LibreNMS project, leveraging Docker and Docker Compose for orchestration. The platform is hosted on an Ubuntu Server 24.04 LTS virtual machine running on Proxmox.
Virtual Machine Configuration
The Proxmox VM was provisioned with the following resources:
- 2 vCPUs
- 8 GB RAM
- 120 GB virtual disk
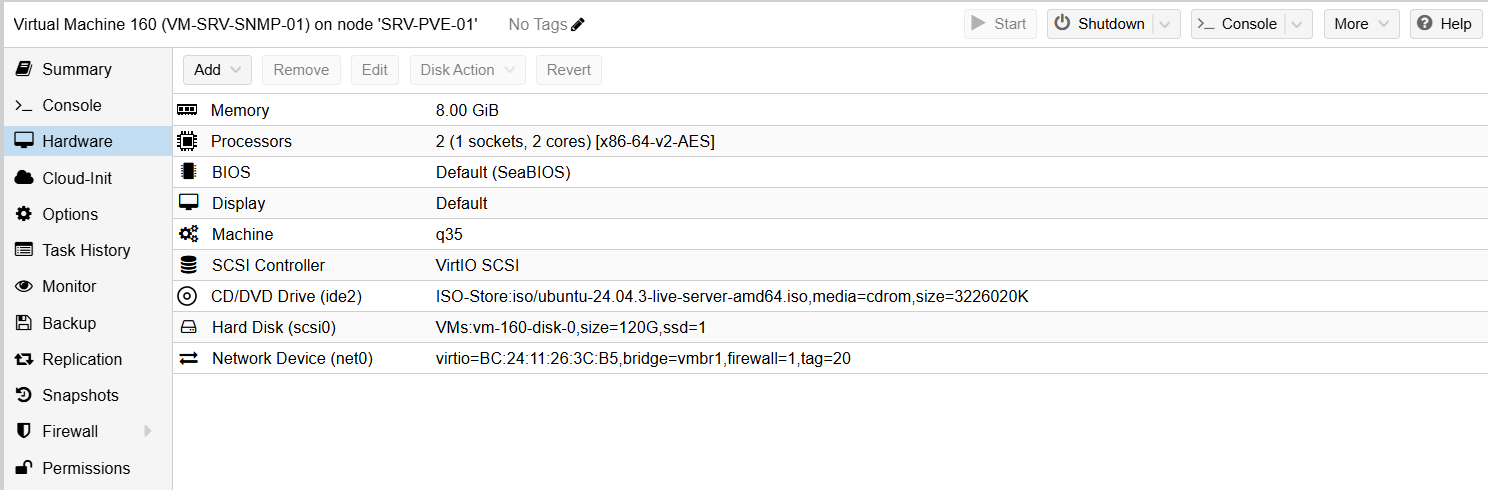
This sizing provides ample headroom for polling, time-series data storage, and future growth.
After installing the latest OS updates, I installed Docker using Docker’s official repository and GPG signing keys:
mkdir -p /etc/apt/keyrings

curl -fsSL https://download.docker.com/linux/ubuntu/gpg \
  | gpg --dearmor -o /etc/apt/keyrings/docker.gpg

echo \
  "deb [arch=$(dpkg --print-architecture) signed-by=/etc/apt/keyrings/docker.gpg] \
  https://download.docker.com/linux/ubuntu \
  $(lsb_release -cs) stable" \
  > /etc/apt/sources.list.d/docker.list

apt update

apt install -y docker-ce docker-ce-cli containerd.io docker-buildx-plugin docker-compose-plugin
This installs:
- Docker Engine
- Docker CLI
- containerd
- Buildx
- Docker Compose (plugin-based)
LibreNMS Docker Stack
I then downloaded and customized the LibreNMS-provided Docker Compose template, which defines the following services:
- db (MariaDB) – underlying database engine
- redis (Redis) – caching and locking backend
- librenms – the LibreNMS web and poller application
- dispatcher – schedules and executes device discovery and polling
Below is the finalized docker-compose.yml used in my deployment:
services:
  db:
    image: mariadb:10.11
    container_name: librenms_db
    command: --character-set-server=utf8mb4 --collation-server=utf8mb4_unicode_ci
    environment:
      TZ: ${TZ}
      MARIADB_DATABASE: librenms
      MARIADB_USER: librenms
      MARIADB_PASSWORD: ${DB_PASSWORD}
      MARIADB_ROOT_PASSWORD: ${DB_ROOT_PASSWORD}
    volumes:
      - ./db:/var/lib/mysql
    restart: unless-stopped

  redis:
    image: redis:7-alpine
    container_name: librenms_redis
    environment:
      TZ: ${TZ}
    volumes:
      - ./redis:/data
    restart: unless-stopped

  librenms:
    image: librenms/librenms:latest
    container_name: librenms
    hostname: snmp.edbradleyweb.local
    cap_add:
      - NET_ADMIN
      - NET_RAW
    depends_on:
      - db
      - redis
    environment:
      TZ: ${TZ}
      DB_HOST: db
      DB_DATABASE: librenms
      DB_USERNAME: librenms
      DB_PASSWORD: ${DB_PASSWORD}
      REDIS_HOST: redis

      # Web/UI
      APP_URL: https://snmp.edbradleyweb.local
      SESSION_SECURE_COOKIE: "true"

      # Fix: use Redis for locks/cache instead of DB
      CACHE_STORE: redis
    volumes:
      - ./librenms:/data
    ports:
      - "127.0.0.1:8000:8000"
    restart: unless-stopped

  dispatcher:
    image: librenms/librenms:latest
    container_name: librenms_dispatcher
    depends_on:
      - librenms
      - redis
      - db
    environment:
      TZ: ${TZ}
      DB_HOST: db
      DB_DATABASE: librenms
      DB_USERNAME: librenms
      DB_PASSWORD: ${DB_PASSWORD}
      REDIS_HOST: redis

      # REQUIRED: actually enables polling in the dispatcher container
      DISPATCHER_NODE_ID: dispatcher-01
      SIDECAR_DISPATCHER: "1"

      # Keep locking consistent
      CACHE_STORE: redis
    volumes:
      - ./librenms:/data
    restart: unless-stopped
Bringing the Stack Online
With the configuration in place, I started the container stack:
docker compose pull
docker compose up -d
docker compose ps
I verified that the containers were up and running as expected:
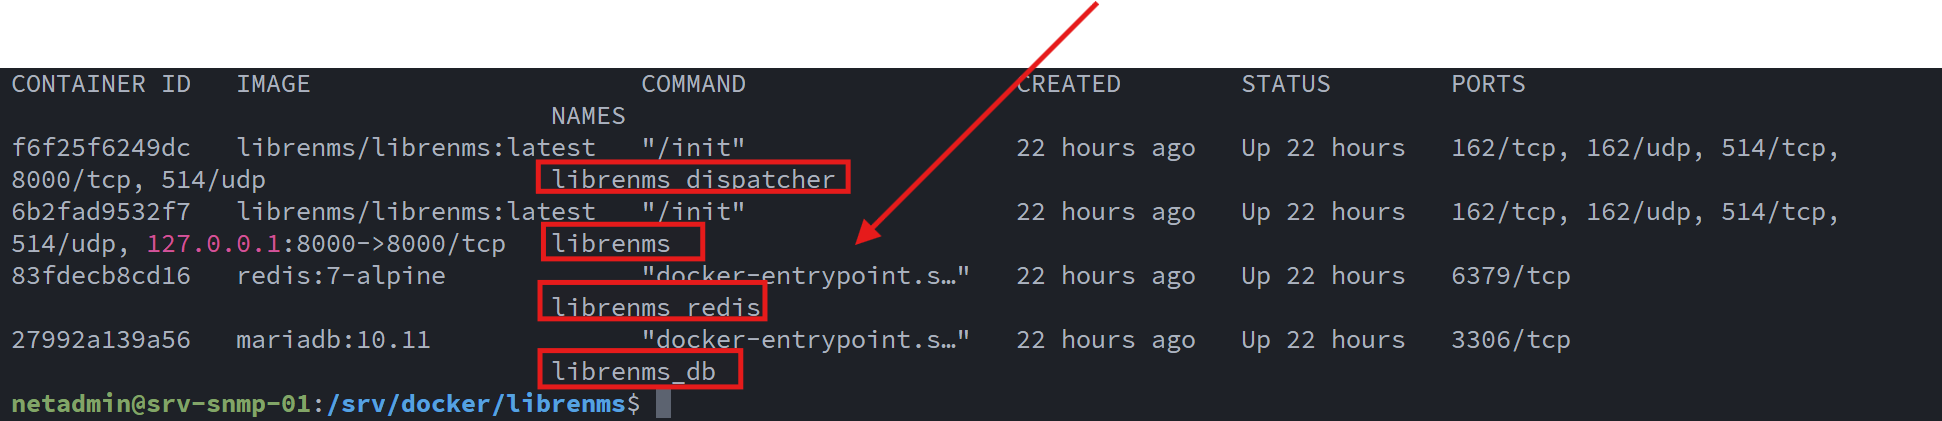
At this point, the LibreNMS containers are able to receive:
- SNMP polling and traps (UDP/TCP 162)
- Syslog data (UDP/TCP 514)
- Web UI traffic (localhost:8000)
Enabling HTTPS with Internal PKI
To serve the LibreNMS Web UI over standard ports (80/443) and secure it with TLS, I deployed NGINX as a reverse proxy on the Ubuntu host.
Because LibreNMS is hosted entirely on my internal lab intranet, I leveraged the internal PKI and Certificate Authority that I built earlier (covered in this post).
First, I installed NGINX on the Ubuntu Host:
sudo apt -y install nginx
sudo systemctl enable --now nginx
I generated a certificate signing request (CSR) for snmp.edbradleyweb.local:
sudo mkdir -p /etc/ssl/snmp
cd /etc/ssl/snmp

sudo openssl req -new -newkey rsa:2048 -nodes \
  -keyout snmp.edbradleyweb.local.key \
  -out snmp.edbradleyweb.local.csr \
  -subj "/C=US/ST=Illinois/L=Chicago/O=edbradleyweb/OU=Lab/CN=snmp.edbradleyweb.local"
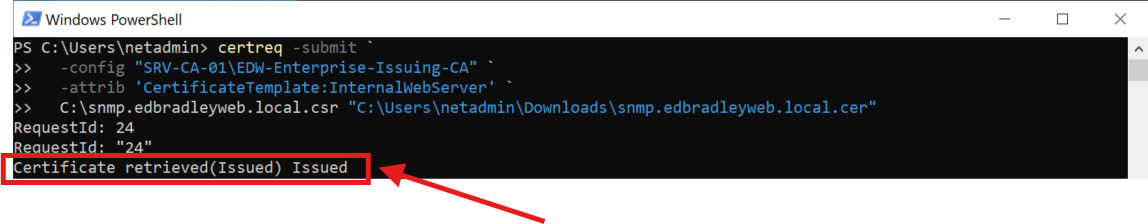
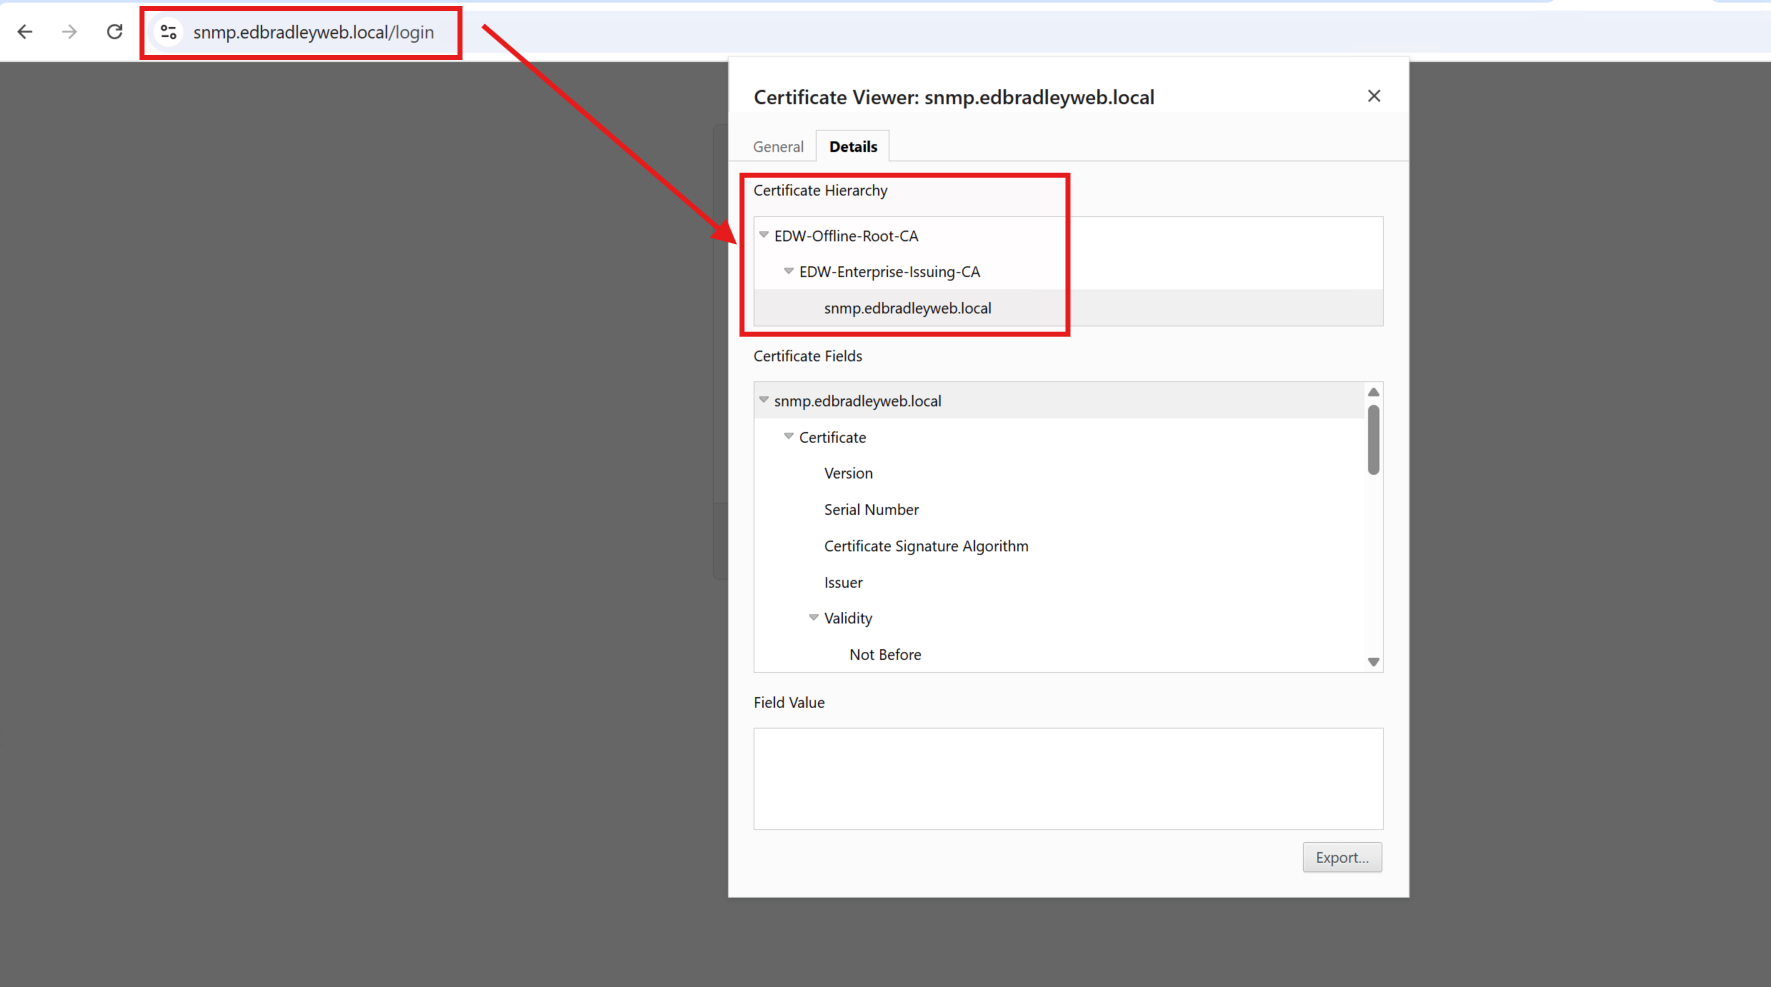
I copied the CSR file over to the Issuing server (SRV-CA-01). The CSR was submitted to the internal CA, signed, and returned as a trusted certificate:
I then bundled the server certificate with the issuing and root CA certificates to form a complete certificate chain file, referenced by NGINX.:
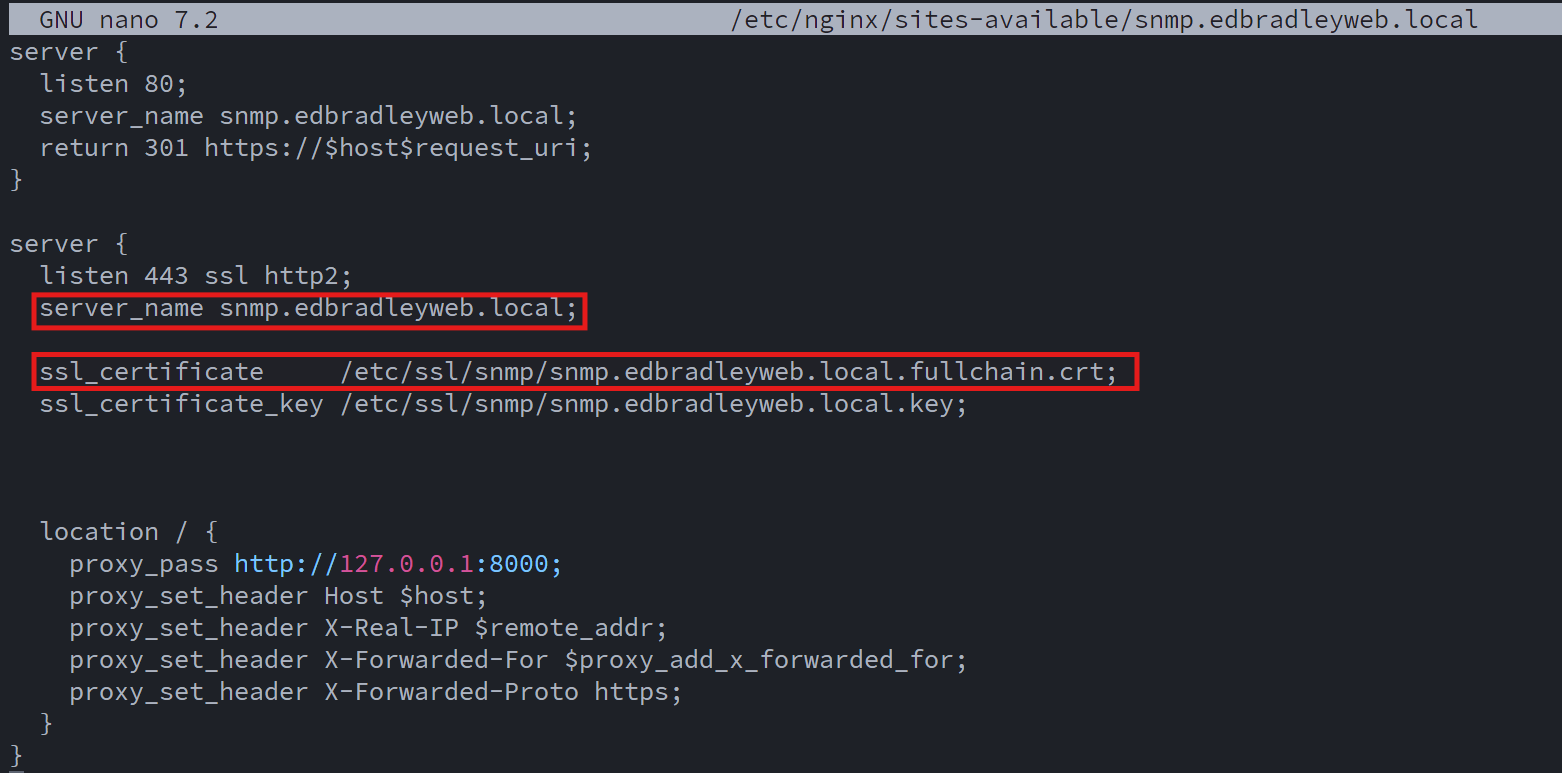
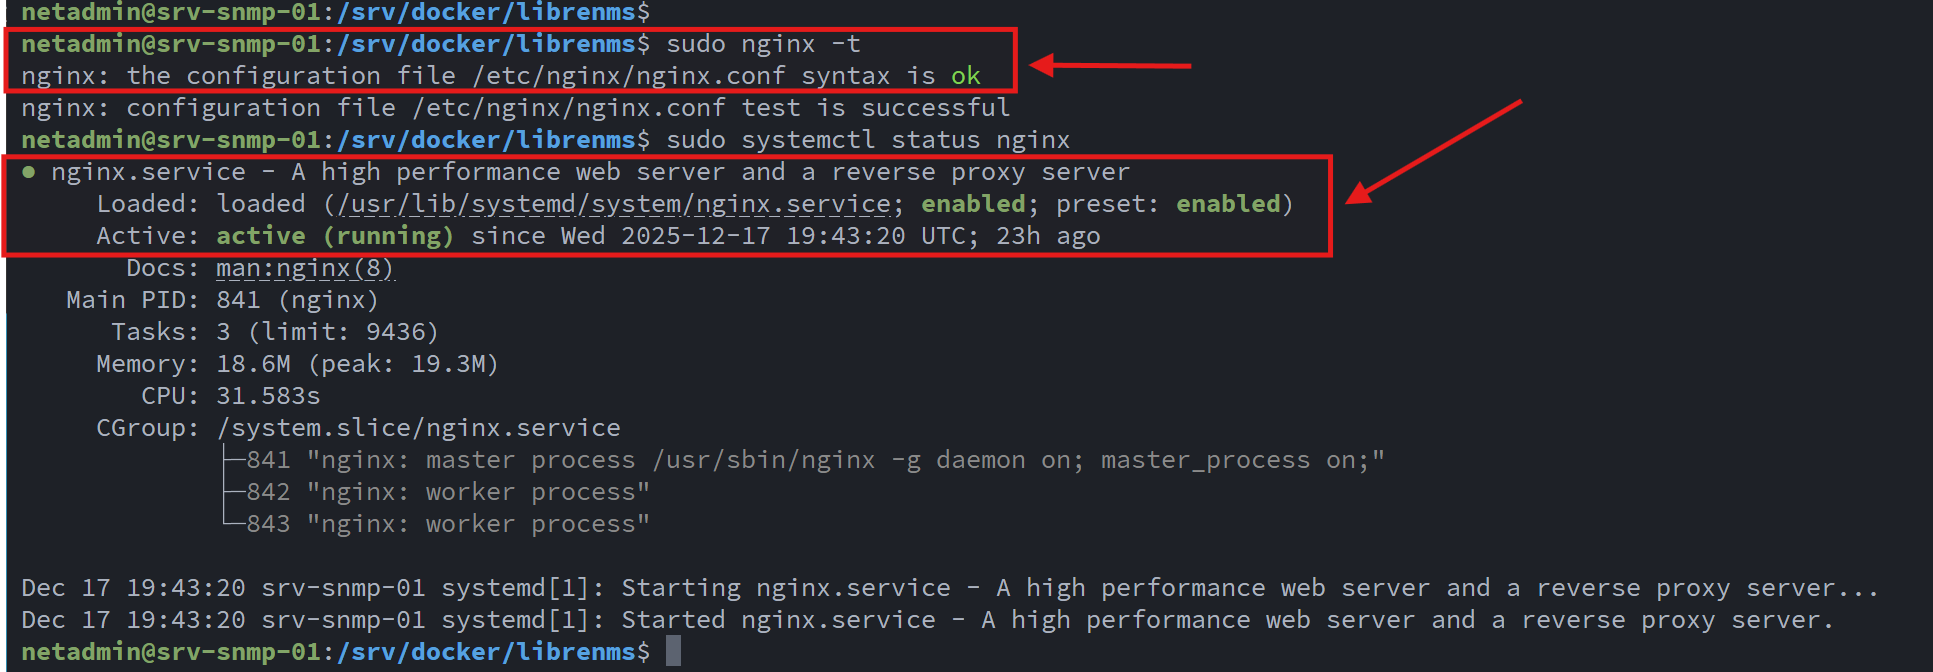
I verified the NGINX configuration was valid and that the Web Server was running:
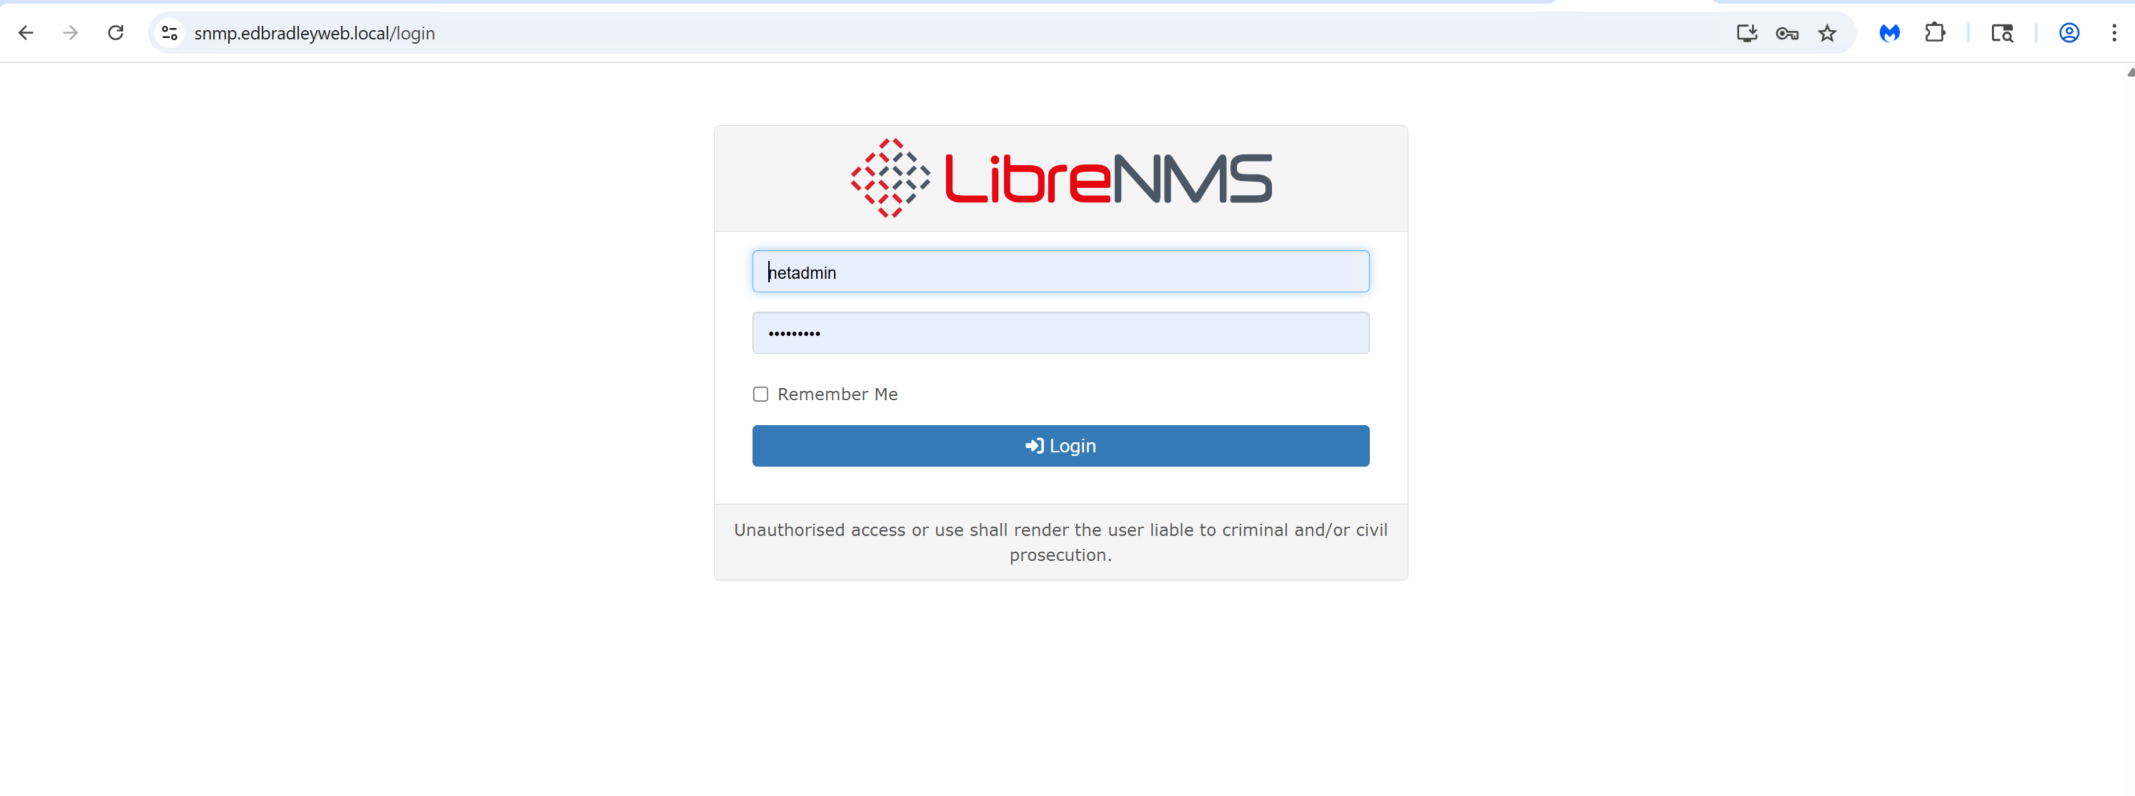
The LibreNMS Web GUI was then available, via HTTPs, using a trusted SSL/TLS certificate, from my lab domain:
With the server up and running, I was then ready to configure the lab devices to report to the server and start monitoring the Network!
Configuring LibreNMS
LibreNMS aggregates and visualizes metrics from devices that support SNMP and Syslog, and generates alerts when devices encounter errors or when metrics fall outside defined thresholds (temperature, bandwidth, storage, availability, etc.).
I configured SNMP across the following device categories:
- Core and access switches
- Firewalls
- Stand-alone Physical Servers
- Virtualization hosts (Proxmox, Hyper-V, ESXi)
I navigated a variety of vendor-specific interfaces to enable SNMP. Wherever possible, I used SNMP v3, which provides authentication and encryption. However, due to the age or class of certain devices, some required SNMP v2c.
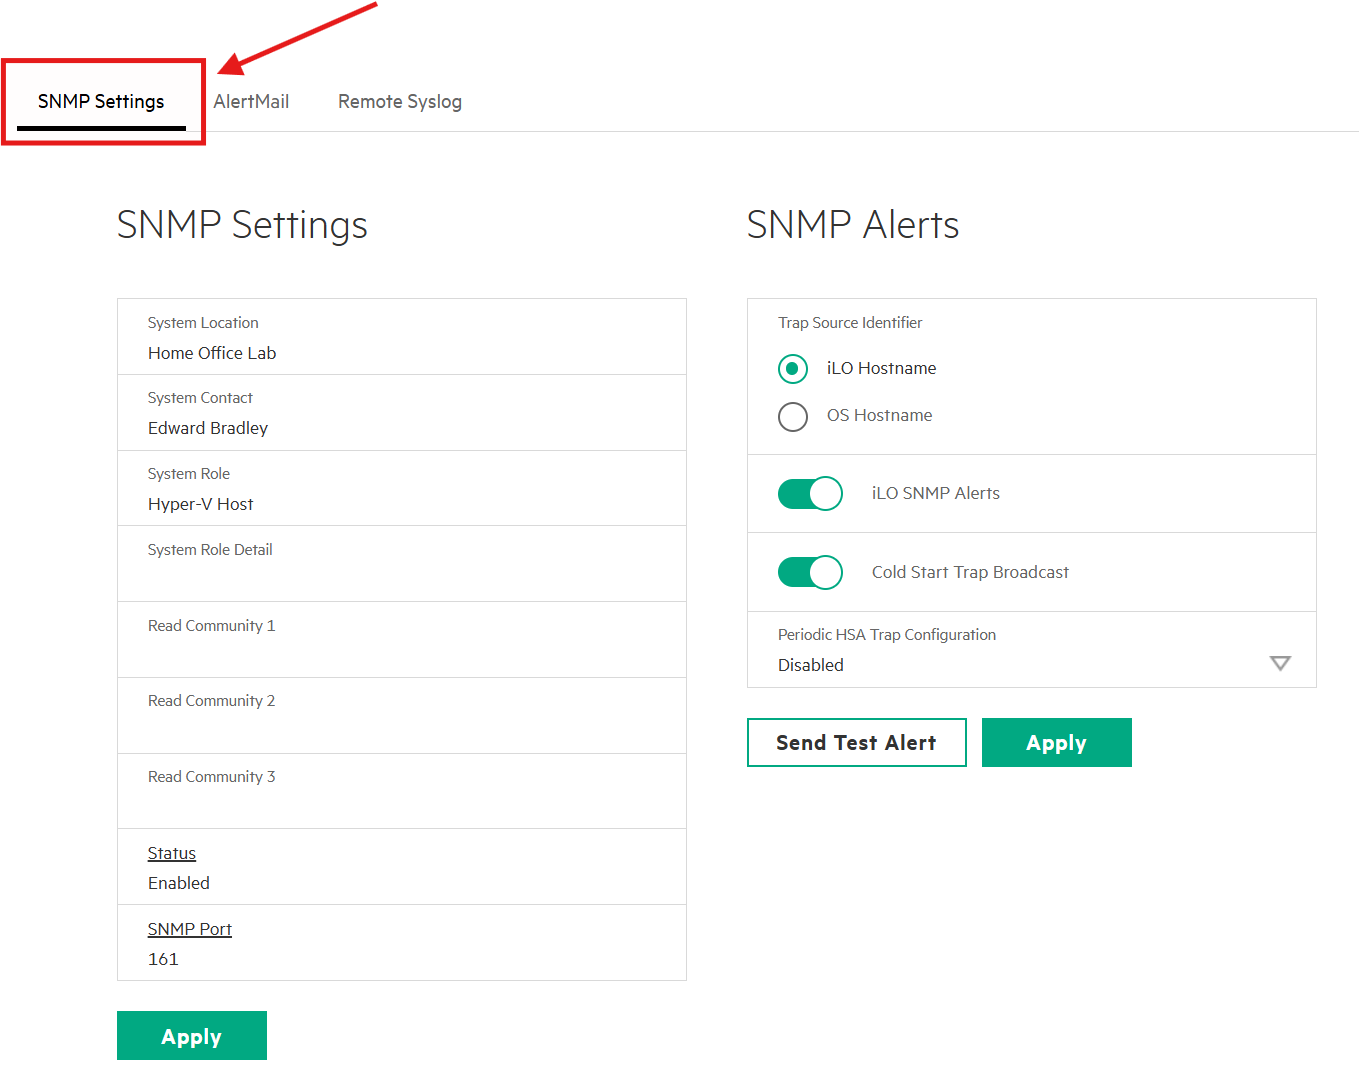
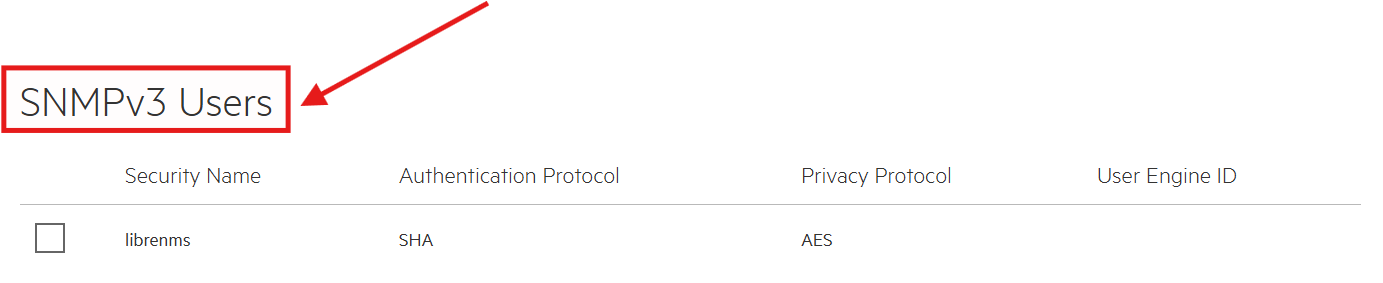
HP iLO management interfaces support full SNMP v3 with authentication and privacy.:
Whereas, entry-level SMB switches only support SNMP v2c, so I mitigated risk by using non-default, read-only community strings and limiting access to the LibreNMS server (SW-EDGE-01 below):
sw-edge-01_config# snmp community LIBRENMS_RO ro
sw-edge-01_config# snmp source-addr 10.0.20.160
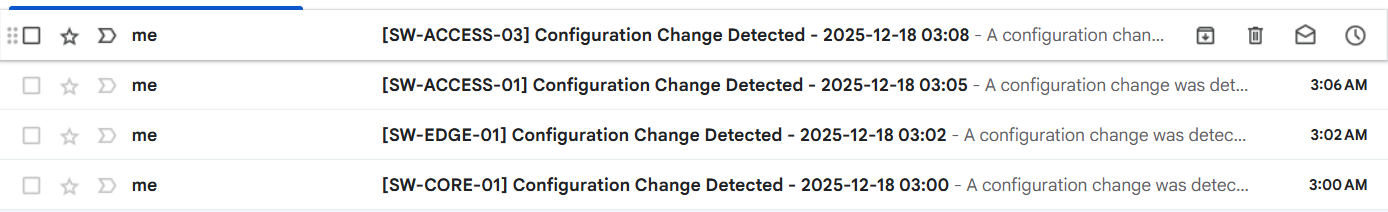
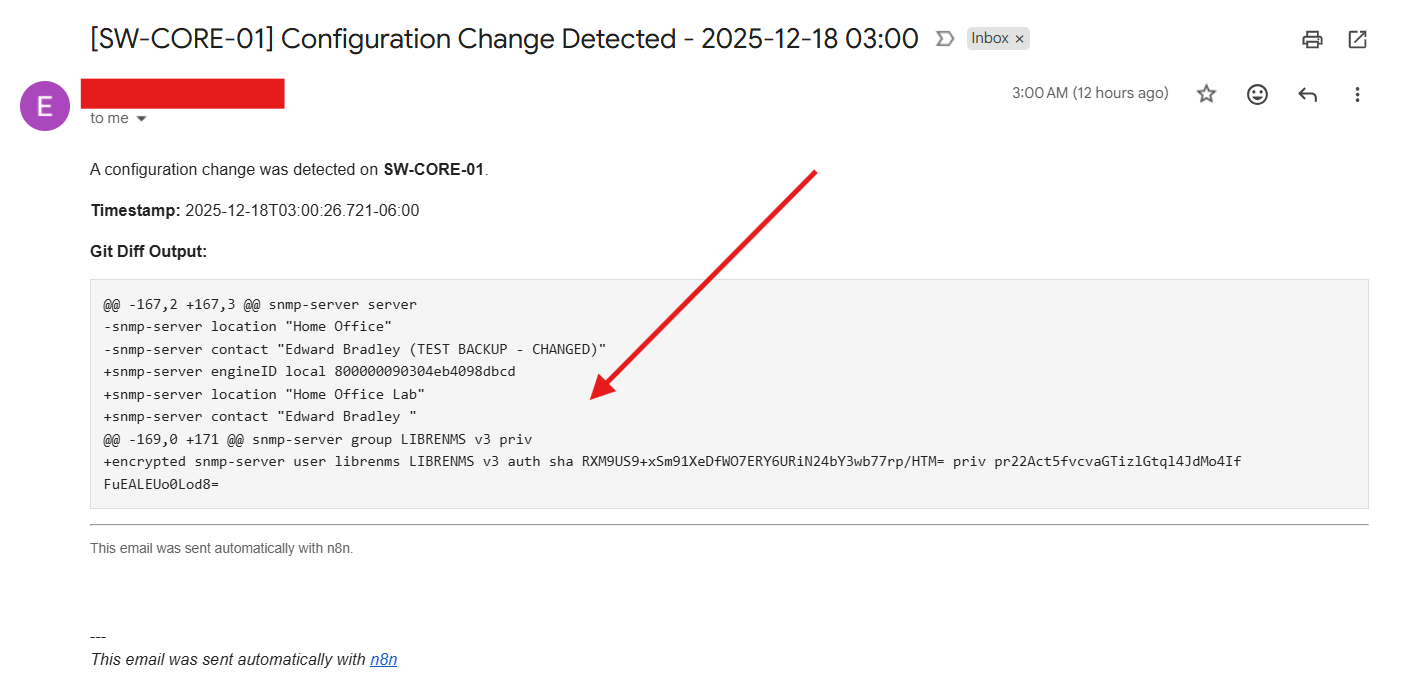
The configuration changes on the switches were automatically detected and backed up by the n8n automation workflow I built in a previous post (Building My Home Lab – Part 9: Deploying a Modern Automation Layer with n8n). This ensures that every network change is captured, versioned, and recoverable without manual intervention!:
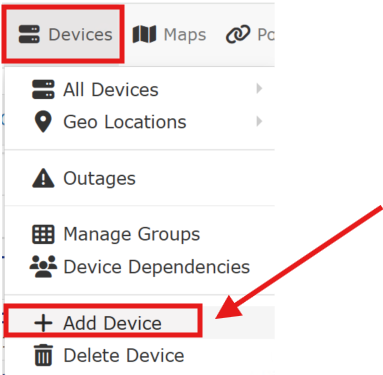
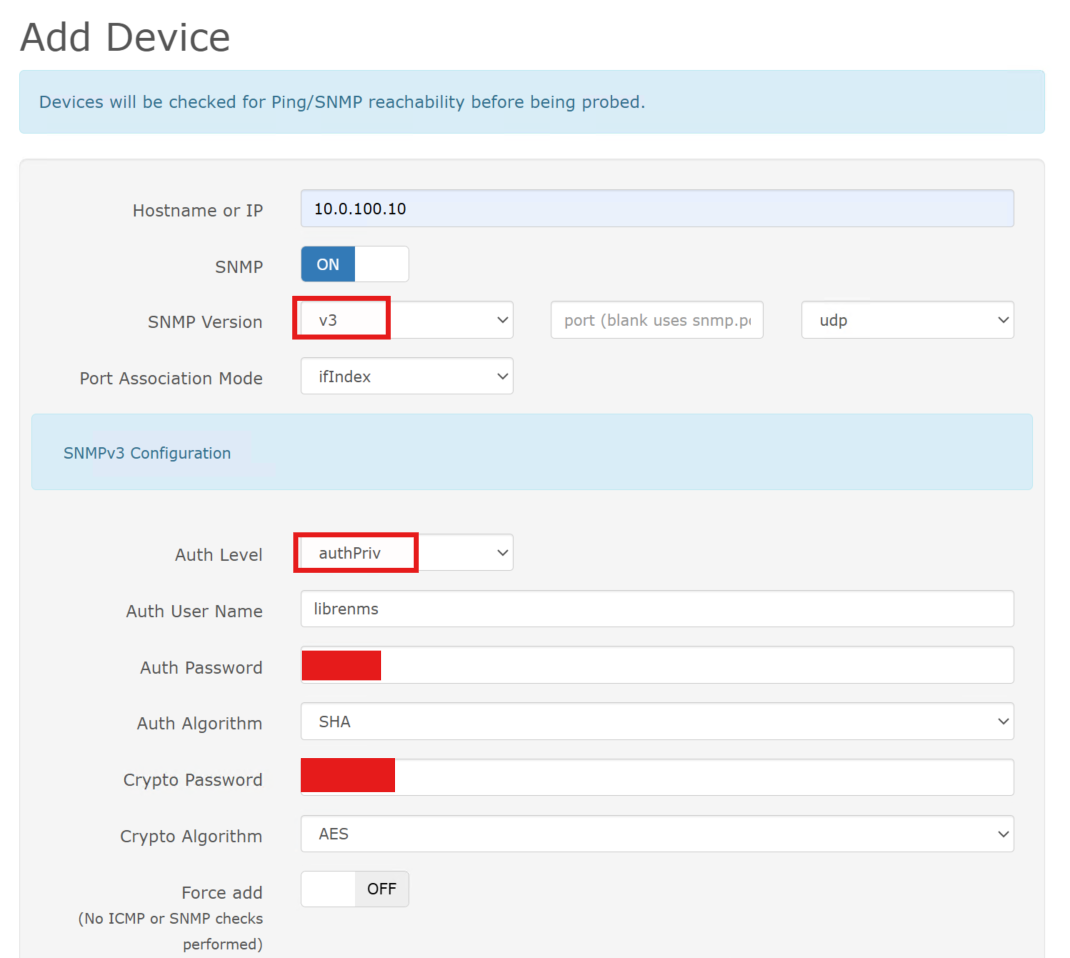
I utilized the LibreNMS GUI to add the individual devices:
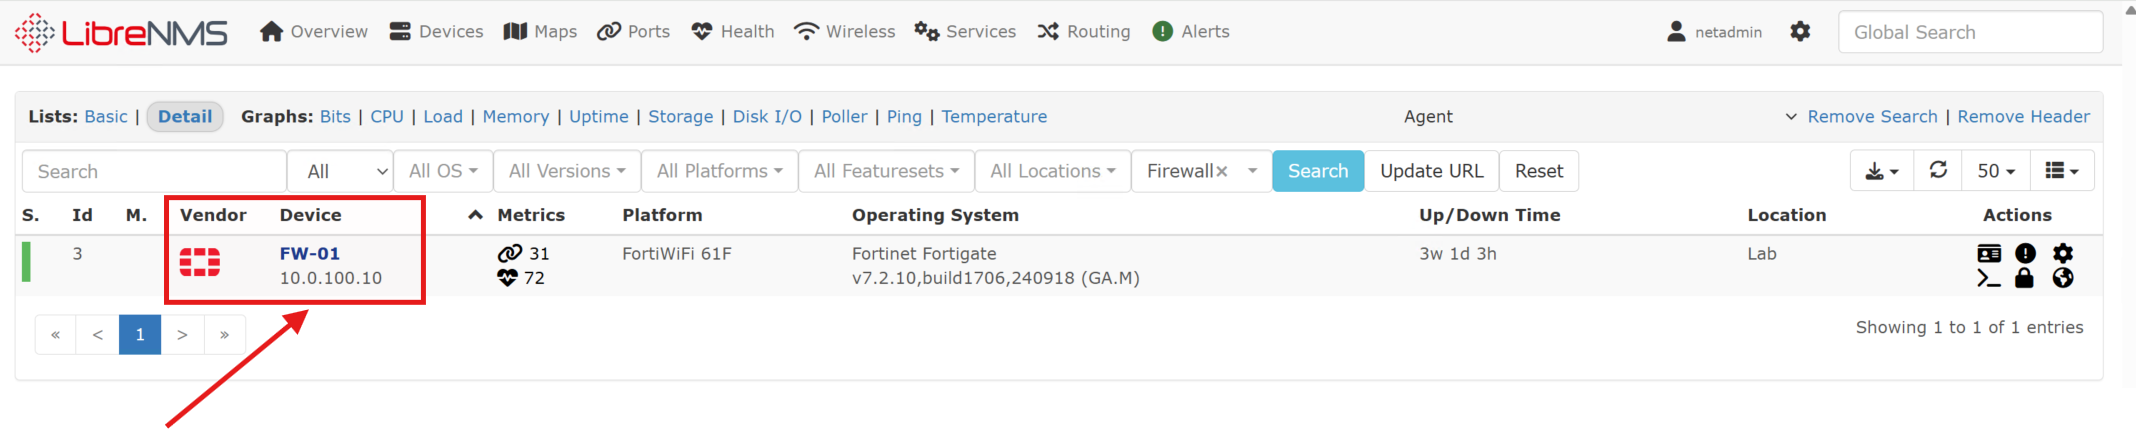
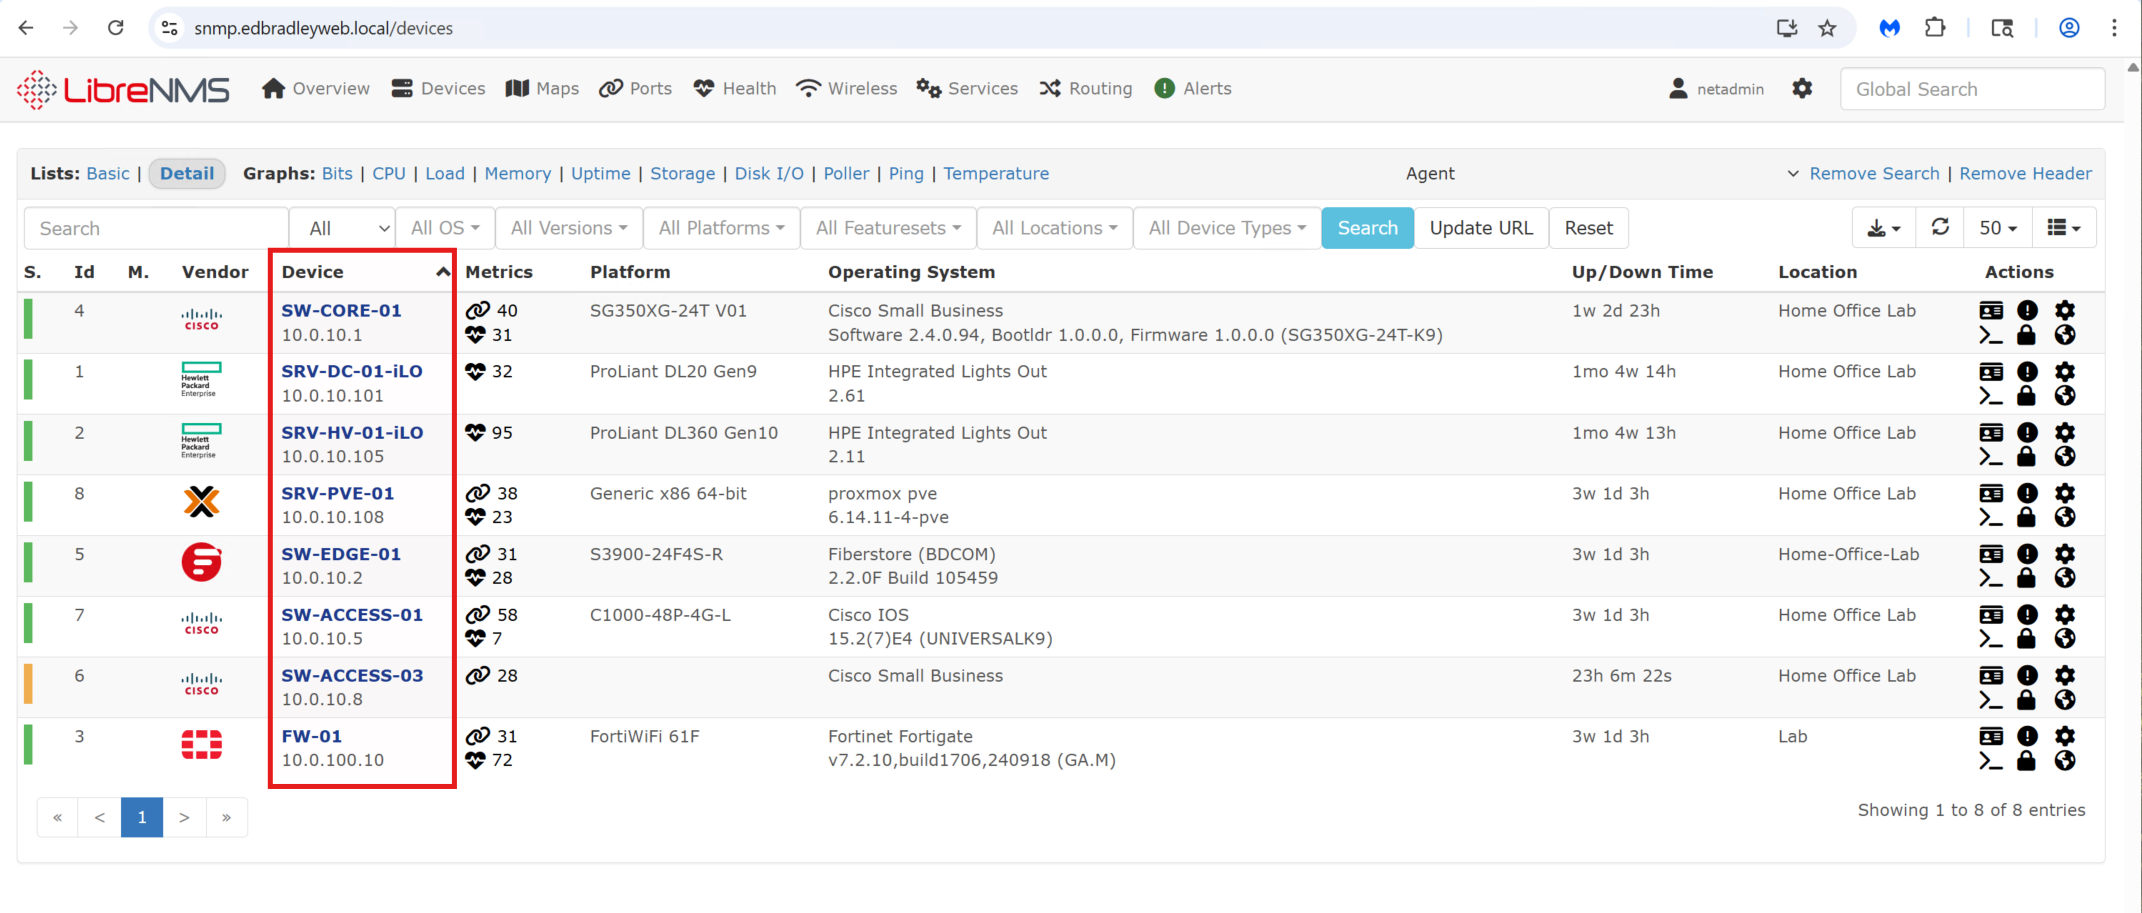
Once added, the device appears on the Device List:
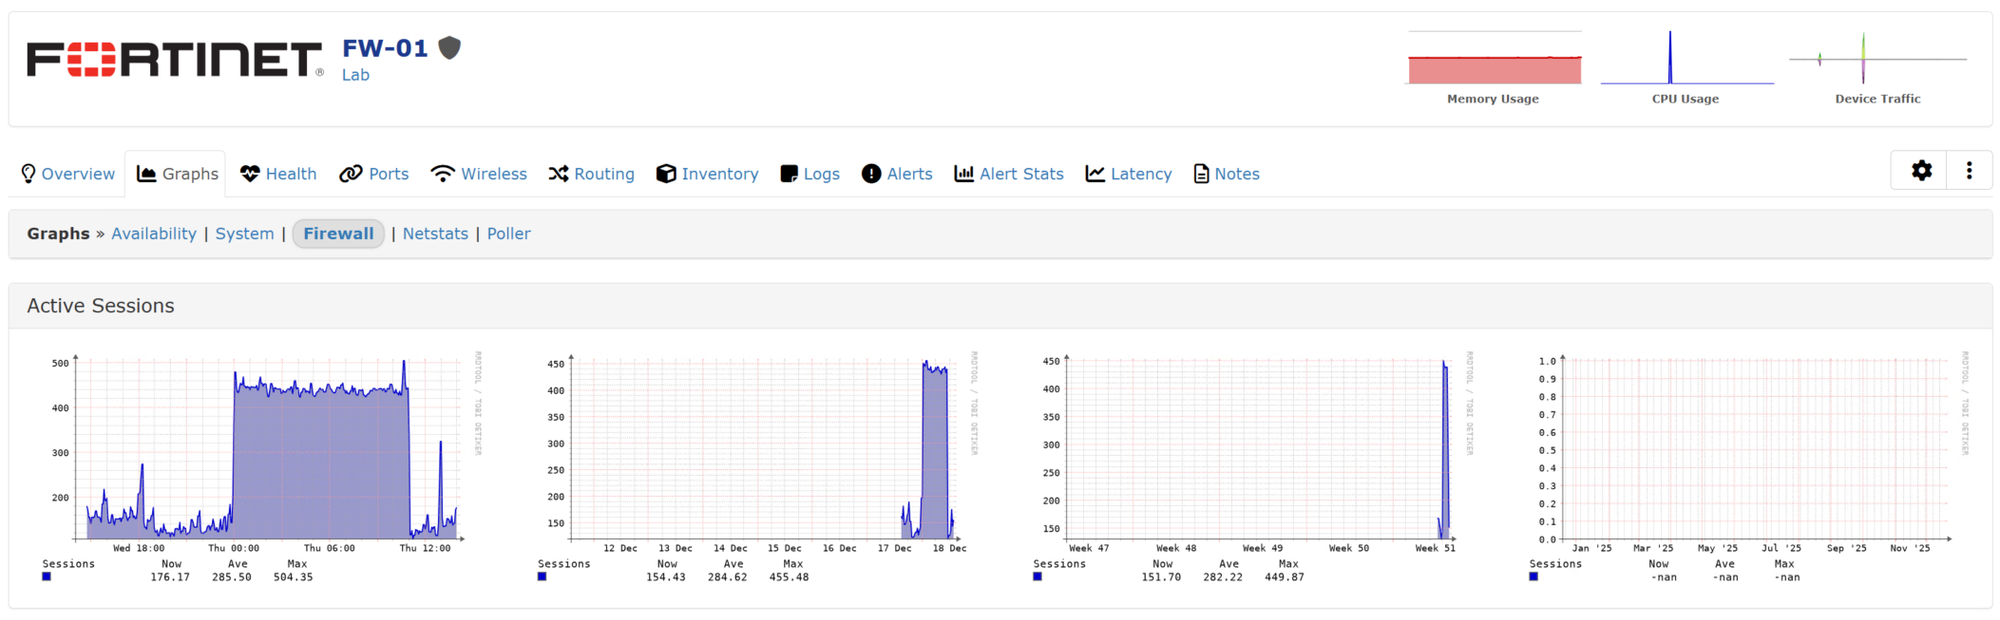
LibreNMS will discover and report the components (ports, sensors, etc.) that the given device exposes through SNMP. LibreNMS will then regularly poll the device (via the dispatcher service) for updates, providing ongoing insight into the disposition of the device. This is great for proactive monitoring, response, and maintenance:
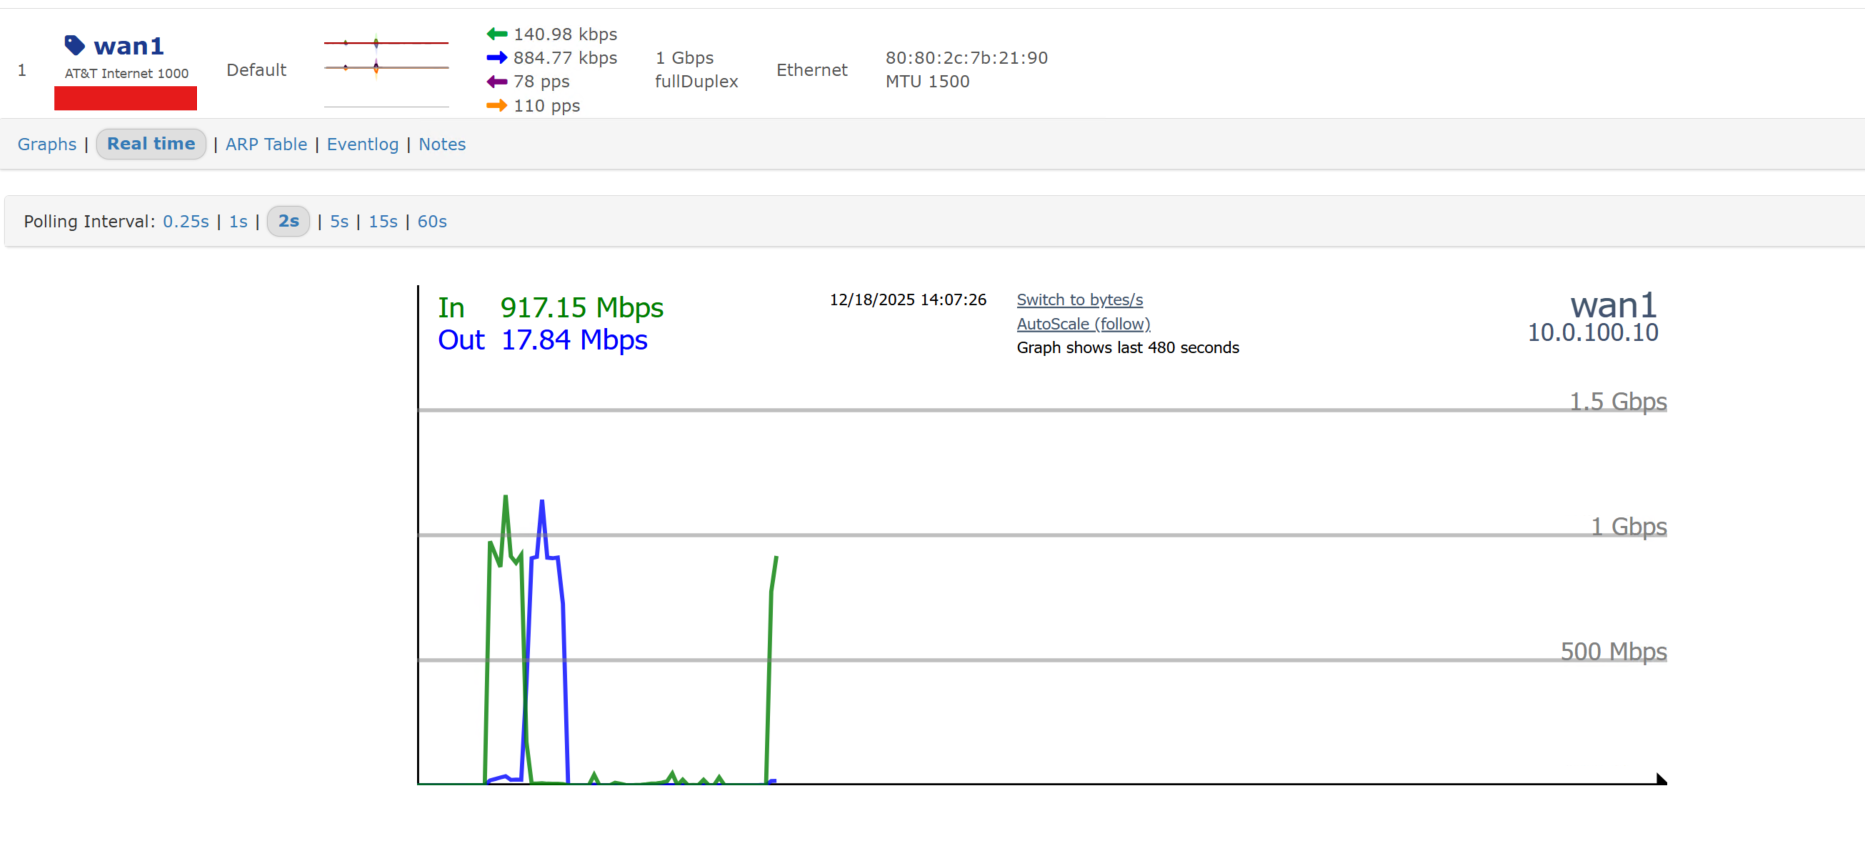
I can even monitor real-time port throughput, as shown below, for Internet access!:
I repeated this process across the rest of the lab infrastructure, gradually building a comprehensive monitoring view of the environment.:
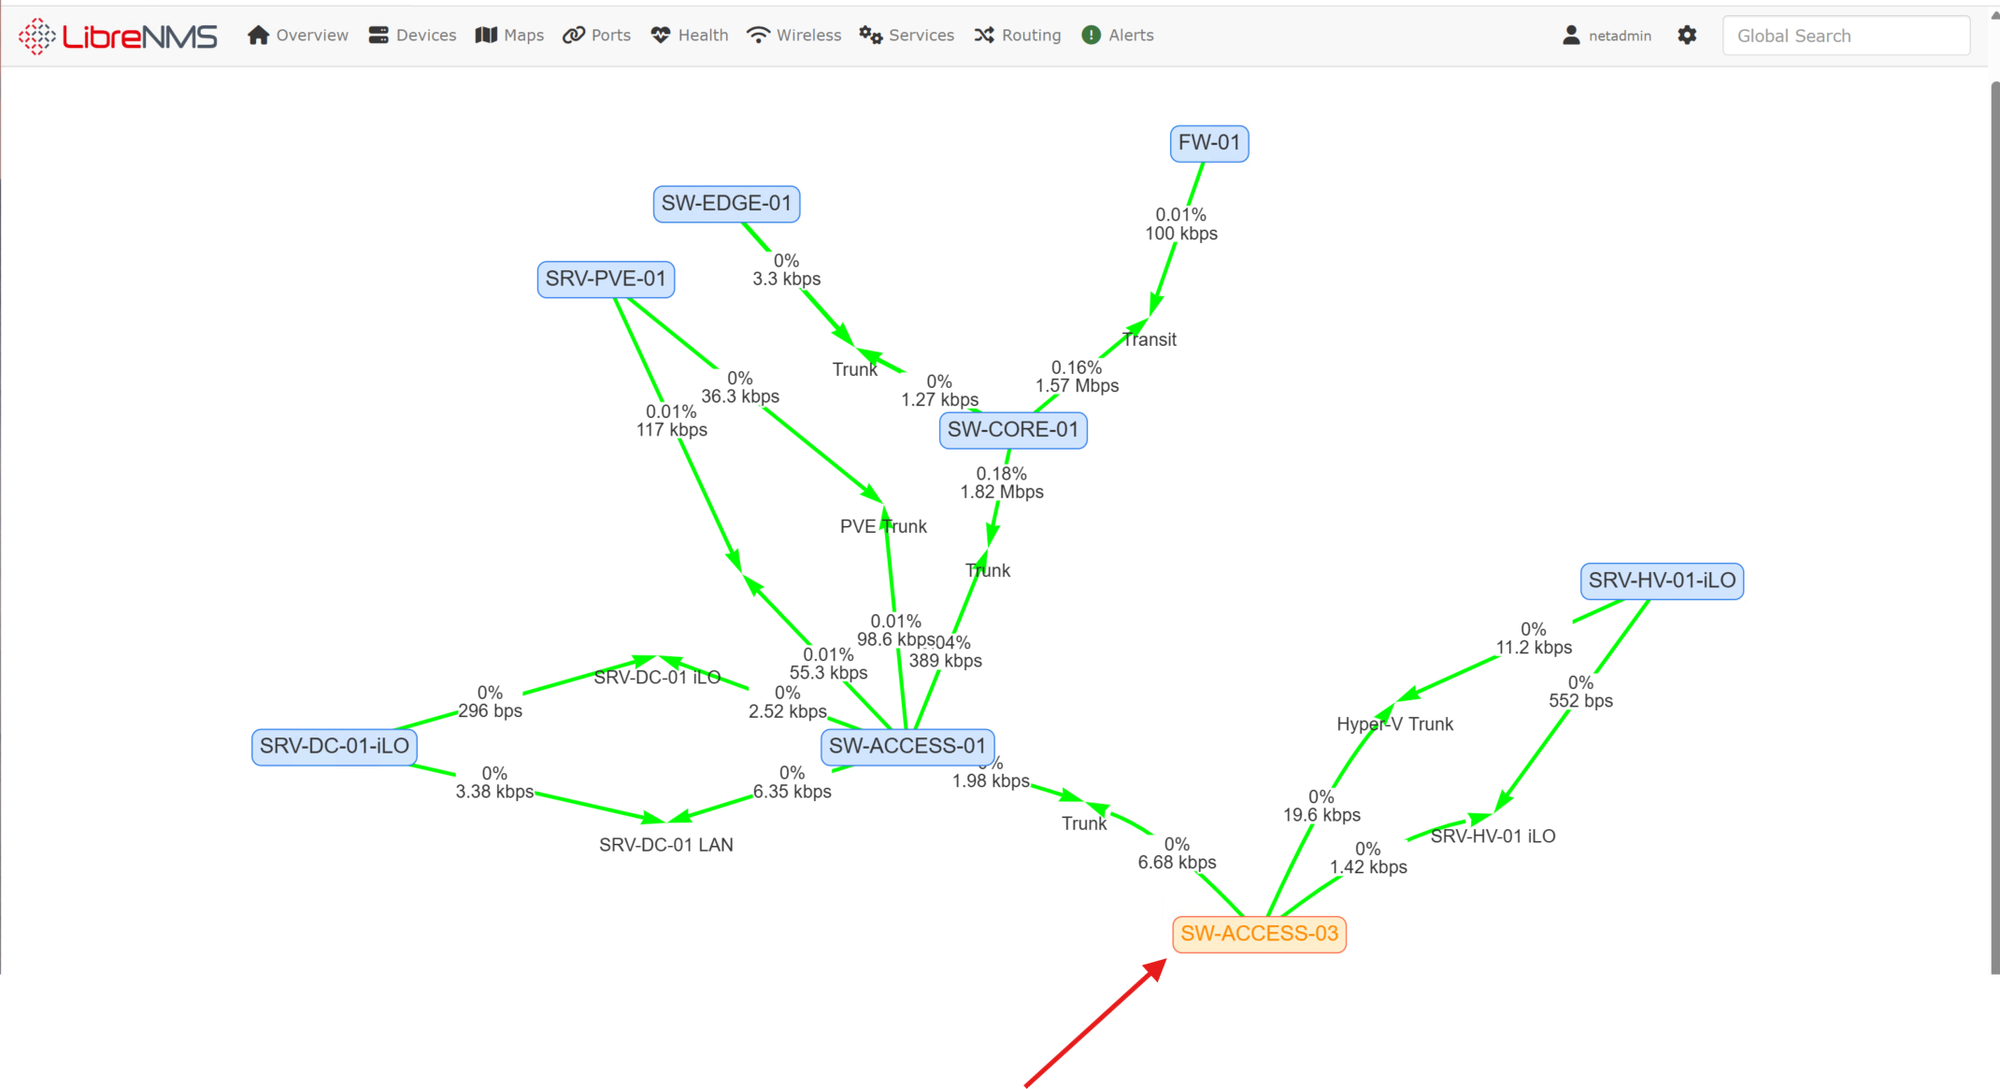
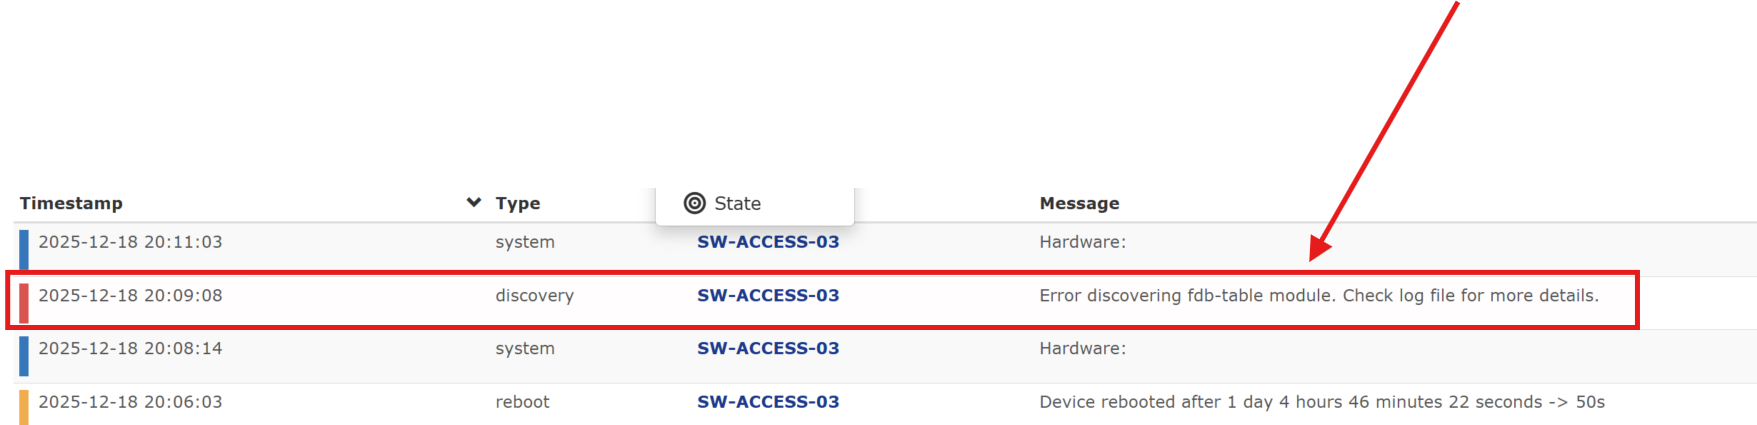
The mapping feature allowed me to create a live topology map of the added devices. And, as shown below, identify, in real-time, when there is an issue with a device (such as the warning on SW-ACCESS-03):
The error occurred after a reboot of the switch. I'll have to dig into what the error message actually means but the switch appears to be functioning normally:
This post only scratches the surface of LibreNMS’s capabilities. In my professional career, I’ve found LibreNMS to be an invaluable tool, especially when diagnosing workflow issues, intermittent failures, and notoriously problematic devices like printers.
Wrap up
Deploying LibreNMS in my lab has added a critical layer of visibility and operational awareness to the environment. With centralized, time-series monitoring in place, I can now continuously observe the health, performance, and availability of network and infrastructure devices, rather than reacting only after issues become user-visible or disruptive.
By containerizing LibreNMS on an Ubuntu Server VM with Docker and Docker Compose, the platform remains cleanly separated from the host OS, easy to update, and straightforward to scale as the lab grows. Integrating the web interface with my internal PKI and serving it over HTTPS further aligns the deployment with enterprise best practices, even in a fully internal environment.
Configuring SNMP across a diverse set of devices highlighted both the strengths and limitations of real-world infrastructure. Where supported, SNMP v3 provides secure, authenticated telemetry, while older or entry-level devices required pragmatic accommodations with SNMP v2c and compensating controls. Combining this monitoring layer with automation (n8n) and security tooling (Wazuh) reinforces the broader goal of the lab: building an environment that mirrors modern enterprise NOC and SOC workflows.
While this post focused on establishing core monitoring functionality, LibreNMS offers far more depth, advanced alerting, custom dashboards, API-driven integrations, distributed polling, and historical trend analysis. In future posts, I plan to expand on alert tuning, long-term capacity planning, deeper SOC integrations, and leveraging monitoring data to drive proactive maintenance and security insights.
With LibreNMS now firmly in place, the lab has moved one step closer to a fully integrated, observable, and automation-driven infrastructure, providing both practical operational value and a powerful platform for continued learning and experimentation.