
Introduction
With the Private Key Infrastructure (PKI) now established, the next major step in my home lab journey is building a fully functional internal Security Operations Center (SOC). Leveraging open-source tools and enterprise-inspired architecture, I’m deploying a self-contained “Mini SOC” on my Dell Precision Workstation running Proxmox VE 9.x. This environment is designed to closely mimic the capabilities of a real-world enterprise SOC, bringing together components such as a SIEM (Security Information and Event Management), EDR-style host monitoring, network intrusion detection, deep packet analysis, system health observability, and centralized log indexing/search. While scaled for a single-user lab, the architecture and tooling reflect the same concepts and workflows used by professional security teams, making it a powerful learning and experimentation platform.
Proxmox Virtual Environment (PVE)
For the SOC deployment, I chose to build the environment on Proxmox Virtual Environment (PVE). Proxmox is a powerful open-source hypervisor that has surged in popularity, especially in the wake of Broadcom’s acquisition of VMware. With VMware’s new pricing model and licensing restrictions becoming increasingly prohibitive for many organizations, Proxmox VE has emerged as a compelling alternative, offering enterprise-grade features without the enterprise-grade cost. This shift has prompted many IT teams to re-evaluate their virtualization strategy, and I see that as the perfect opportunity to gain hands-on experience with Proxmox. By using PVE as the backbone of my Mini SOC, I’m not only building a unified security lab, but also strengthening my skill set in a platform that’s quickly becoming a mainstream choice for both home labs and production environments.
Components of the Mini SOC
To replicate an enterprise-grade Security Operations Center inside a home lab, the Mini SOC is built from several specialized, open-source components—each serving a distinct role in visibility, detection, analysis, or monitoring. Together, they form a unified security ecosystem capable of ingesting, enriching, and correlating data from across the network.
1.) OpenSearch – Central Log Indexer & Search Engine:
OpenSearch (https://opensearch.org/) acts as the SOC’s centralized data lake and search engine. All logs, telemetry, alerts, and network security events flow into this cluster for long-term storage, fast querying, and correlation. It serves the same role as Elasticsearch or Splunk in larger enterprises, forming the analytical backbone of the SOC.
2.) Wazuh Manager – SIEM, Correlation Engine & Host Monitoring:
Wazuh (https://wazuh.com/) is the primary SIEM component. It collects endpoint logs, parses events, applies detection rules, evaluates vulnerabilities, performs file integrity monitoring, and produces security alerts. Wazuh enriches and structures the data before forwarding it into OpenSearch. It also provides centralized agent management for any monitored endpoints.
3.) Wazuh Dashboard – Analyst Interface & Visualization Layer:
The Wazuh Dashboard is the analyst’s front-end console. It provides a rich web interface for reviewing alerts, running queries, monitoring agent status, accessing threat intelligence correlations, and browsing dashboards. It effectively acts as the SOC’s main monitoring console.
4.) Suricata IDS – Network Intrusion Detection System:
Suricata (https://suricata.io/) sits on a mirrored/SPAN port and inspects network traffic in real time. It uses signature-based detection to identify malicious traffic patterns, scans, exploit attempts, malware command-and-control activity, and unusual protocol behavior. Suricata’s alerts (EVE JSON data) are forwarded into OpenSearch for correlation alongside Wazuh events.
5.) Zeek – Network Protocol & Behavioral Analysis:
Zeek (https://zeek.org/) complements Suricata by generating high-fidelity metadata about network activity. Instead of signature alerts, Zeek produces detailed logs for DNS, HTTP, TLS, SMB, SSH, and other protocols—allowing deep inspection of behavior on the network. This helps detect anomalies, suspicious domain lookups, unusual certificate usage, and lateral movement indicators.
6.) Grafana & Prometheus – System Health & Observability Stack:
Prometheus (https://prometheus.io/) collects metrics (CPU, RAM, disk usage, ingestion rates, packet drops, VM health), while Grafana (https://grafana.com/) provides a visual dashboard layer. These tools allow you to monitor the SOC itself—ensuring that OpenSearch, Suricata, Zeek, and Wazuh are healthy and performing optimally. It’s the SOC’s “health monitoring system.”
7.) NetFlow / ntopng – Network Flow Analytics:
For additional visibility into network behavior, ntopng (https://www.ntop.org/products/traffic-analysis/ntopng/) can ingest NetFlow/sFlow/softflowd data from routers or switches. This highlights top talkers, bandwidth usage, application types, and traffic anomalies. It is especially useful for monitoring IoT devices, guest networks, and general home-network behavior.
8. Proxmox VE – Virtualization Backbone:
All components of the SOC are hosted on Proxmox VE 9.x (https://proxmox.com/en/products/proxmox-virtual-environment/overview), which provides the virtualization infrastructure, VLAN segmentation, storage management, backups, and resource allocation. This allows the SOC to operate as a complete, isolated solution on a single Dell workstation, without requiring separate hardware appliances.
While scaled for a home lab, this Mini SOC mirrors the architecture and workflows found in enterprise environments. It includes:
- Log ingestion and indexing (OpenSearch)
- Security analytics, correlation, and endpoint monitoring (Wazuh)
- Real-time network threat detection (Suricata)
- Network behavioral analysis (Zeek)
- Metrics and system observability (Grafana/Prometheus)
- Network flow intelligence (ntopng)
- Virtualized infrastructure (Proxmox VE)
The result is a powerful, fully self-contained SOC that provides visibility across endpoints, network traffic, and system performance, offering an ideal platform for security learning, experimentation, and hands-on practice.
For this stage of the project, the primary goal was simply to get each component deployed and establish basic interconnectivity and data flow. In the coming weeks, I’ll be fine-tuning the configuration, refining integrations, and completing the full network-wide rollout.
Proxmox VE Server Deployment
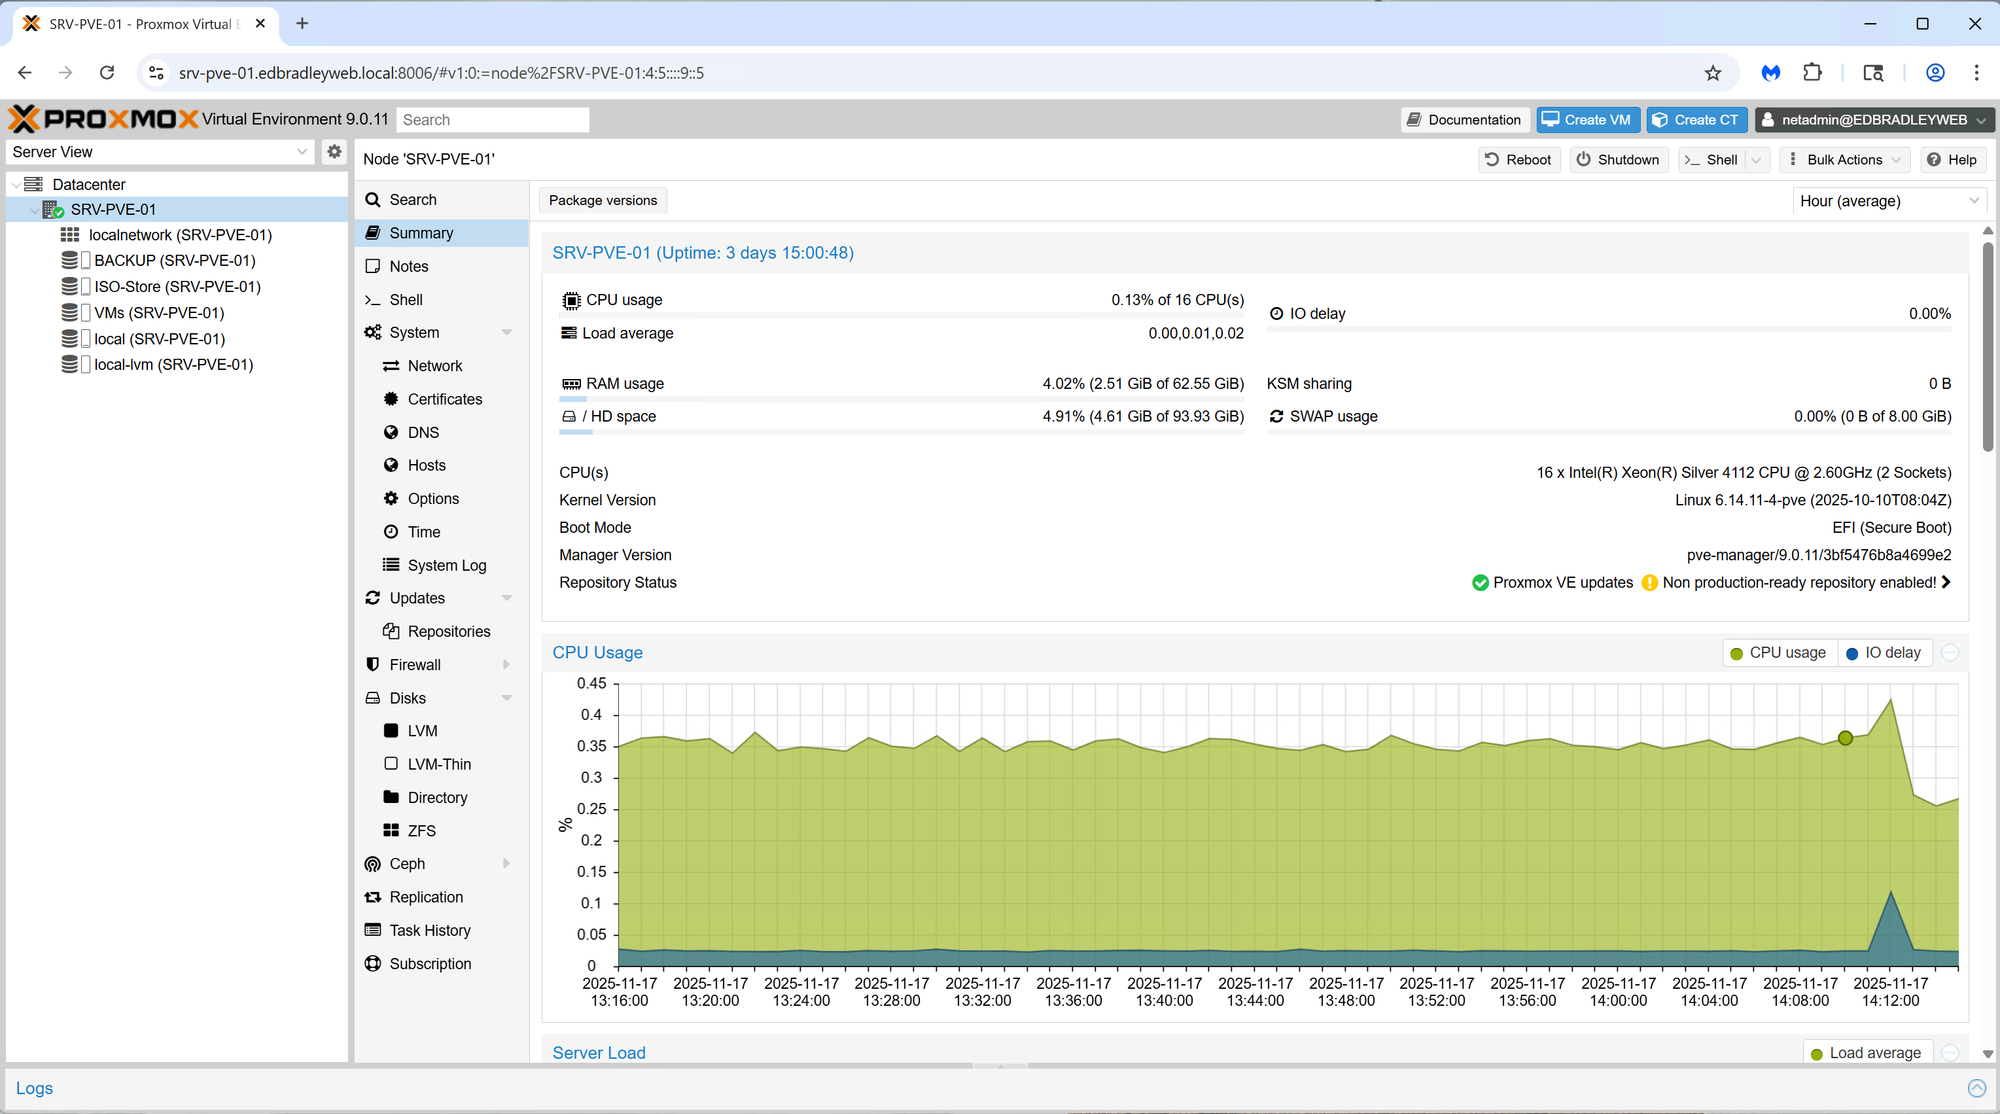
To serve as the foundation for my home lab “Mini SOC”, I began by installing the latest release of Proxmox Virtual Environment (PVE) on my Dell Precision Workstation. This hardware platform provides more than enough horsepower to support an enterprise-style SOC stack while still leaving room for experimentation and future expansion.
Hardware Overview
The workstation is equipped with:
- CPU: Dual Intel Xeon Silver quad-core processors (16 virtual cores total)
- Memory: 64GB ECC RAM
- Storage:
- 1 × 512GB SATA SSD
- 1 × 1TB SATA SSD
- 1 × 2TB SATA SSD
- Networking:
- 1 × on-board 1GbE NIC
- 1 × dual-port 1GbE PCIe NIC
This combination delivers strong multi-VM performance, ECC reliability, and flexible storage options:
Storage Layout and Configuration
Before spinning up any virtual machines or containers, I structured the storage on the Proxmox host with purpose-built partitions:
- /dev/sda – 512GB SSD
- Operating System (Proxmox VE)
- LVM-thin storage for temporary or emergency VM/LXC usage
- /dev/sdb – 2TB SSD
- ZFS pool dedicated to production VM and container storage
- ZFS provides snapshots, checksumming, compression, and self-healing
- /dev/sdc – 1TB SSD
- Formatted as ext4
- Houses ISO images, VM templates, and scheduled VM backups
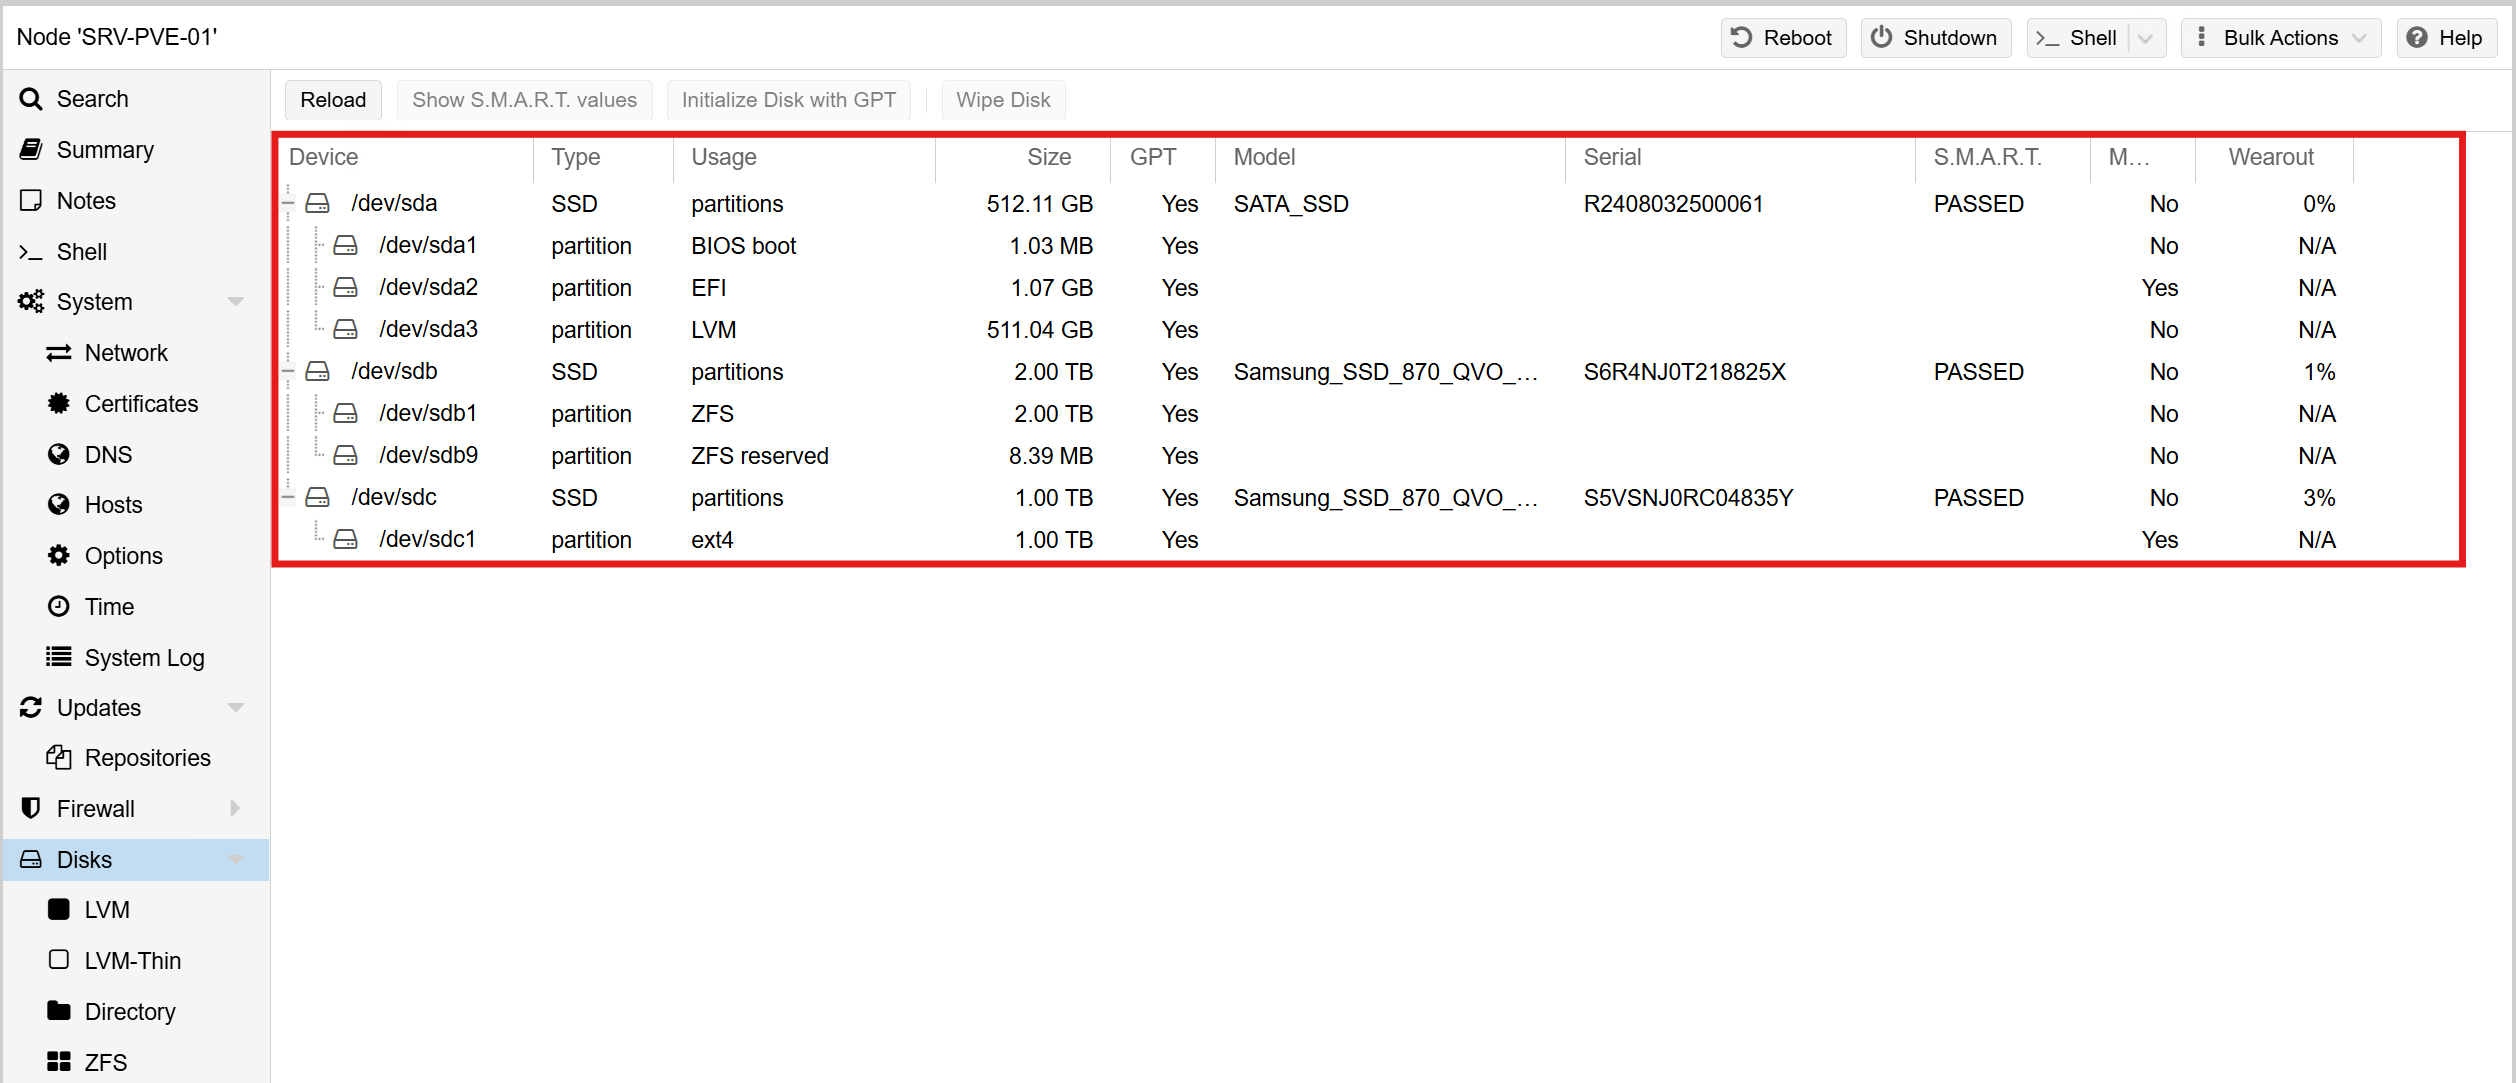
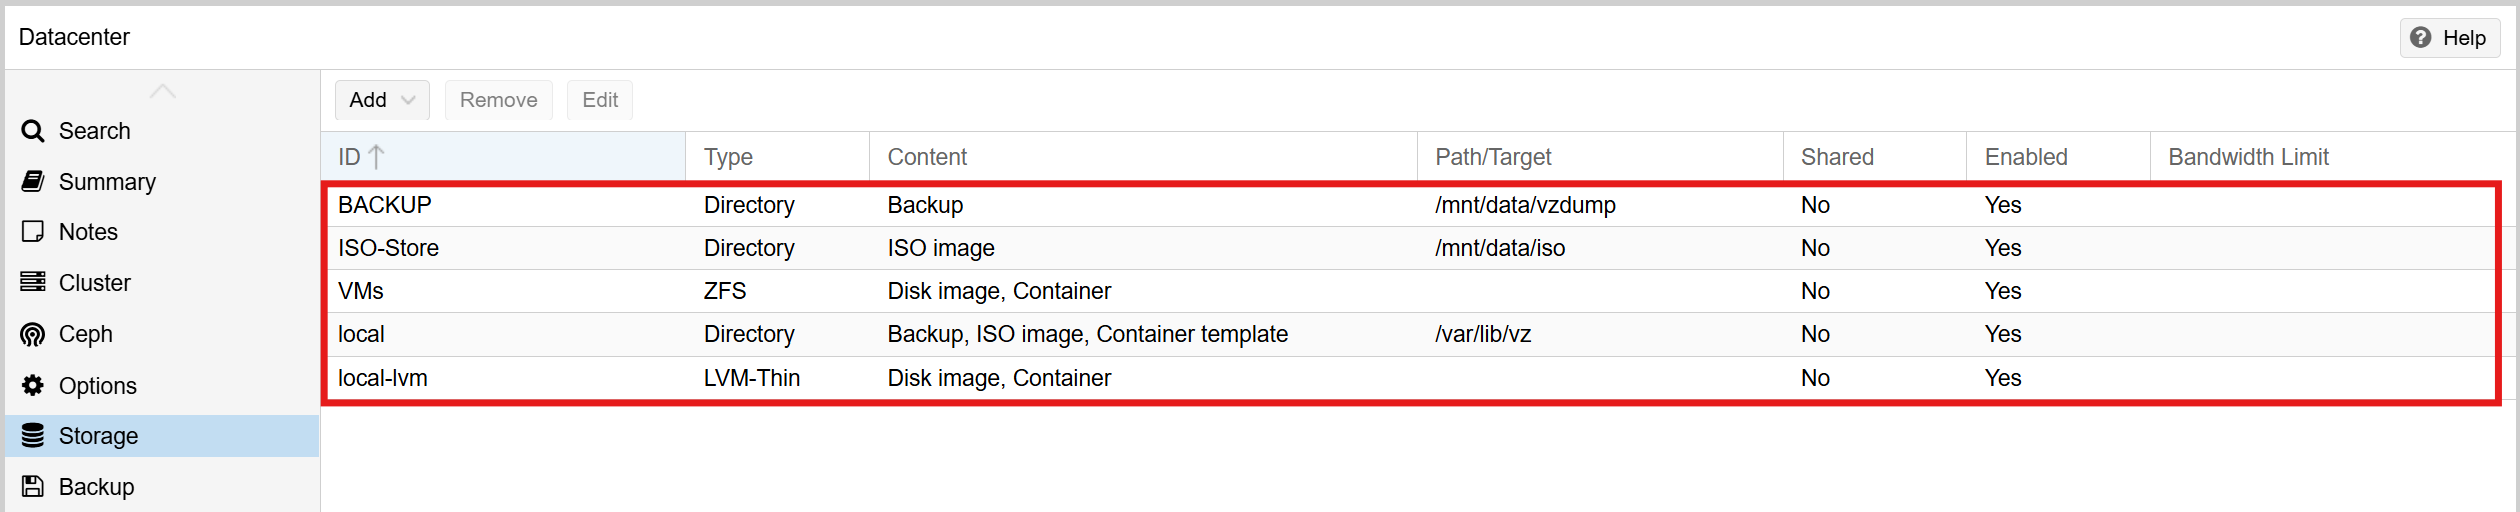
This layout separates durable VM storage from transient files and backups, making the host easier to manage and better aligned with typical enterprise designs.
Networking and Internet Access
To ensure clean separation of management, VM traffic, and security monitoring, I mapped each physical NIC in the Dell Workstation to a dedicated Proxmox bridge. This provides clear traffic boundaries and mirrors the way an enterprise would segment hypervisor access, production workloads, and packet-capture sensors.
1. Onboard 1GbE NIC → Management Network:
- Interface:
enp0s31f6 - Proxmox Bridge:
vmbr0 - VLAN: VLAN 10 – Management
- Purpose:
- Primary management interface for Proxmox
- Provides access to the Web GUI at:
https://srv-pve-01.edbradleyweb.local
This interface is isolated strictly for administrative purposes, ensuring that VM workloads and security monitoring do not overlap with hypervisor management traffic. All Proxmox updates, backups, and AD integration occur over this dedicated mgmt VLAN.
2. Dual-Port PCIe NIC (Port #1) → VM Production Network:
- Interface:
enp4s0f0 - Proxmox Bridge:
vmbr1 - VLANs: Multiple (tagged trunk)
- Switch Connection: Access Switch → Trunk Port
- Purpose:
- Primary interface for VM traffic
- Handles inter-VLAN routing, server workloads, and production VM communications
This bridge carries all VM network segments—including Servers (VLAN 20), Workstations (VLAN 30), Wi-Fi (VLAN 60), and any additional VLANs defined in the SOC architecture. Because it operates as a trunk, each VM can be assigned a specific VLAN tag through Proxmox, giving each virtual machine clean, isolated network placement.
3. Dual-Port PCIe NIC (Port #2) → SPAN / Packet Capture Network:
- Interface:
enp4s0f1 - Proxmox Bridge:
vmbrSPAN - Switch Connection: Core Switch → SPAN / Mirror Port
- Purpose:
- Dedicated, passive interface for full packet capture
- Feeds mirrored network traffic to IDS/NSM tools such as Suricata and Zeek
This interface is configured as a receive-only tap and is not assigned an IP address. It exists solely to ingest mirrored traffic from the Core Switch. This allows security VMs to analyze real-time traffic flows without being part of the production network, preserving both integrity and security.
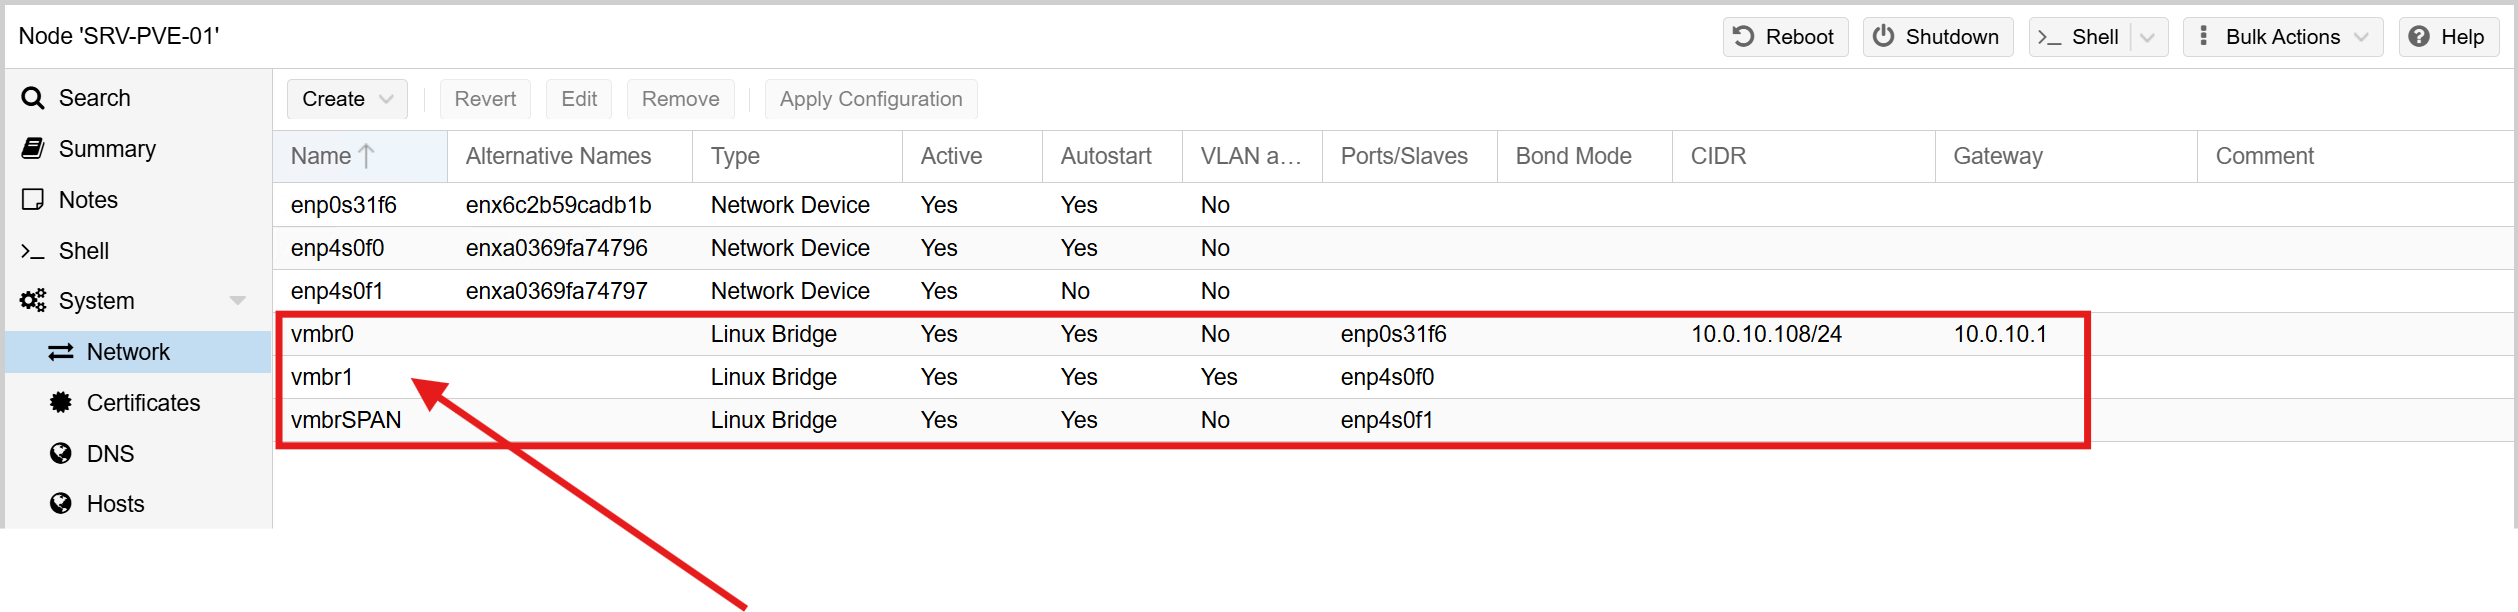
By assigning each NIC to a distinct Proxmox bridge—Management (vmbr0), VM Production (vmbr1), and SPAN Monitoring (vmbrSPAN), the host cleanly separates administrative access, VM data traffic, and network security inspection. This layout closely matches real-world SOC deployments and ensures the upcoming Mini SOC tools operate in a controlled, well-segmented environment.
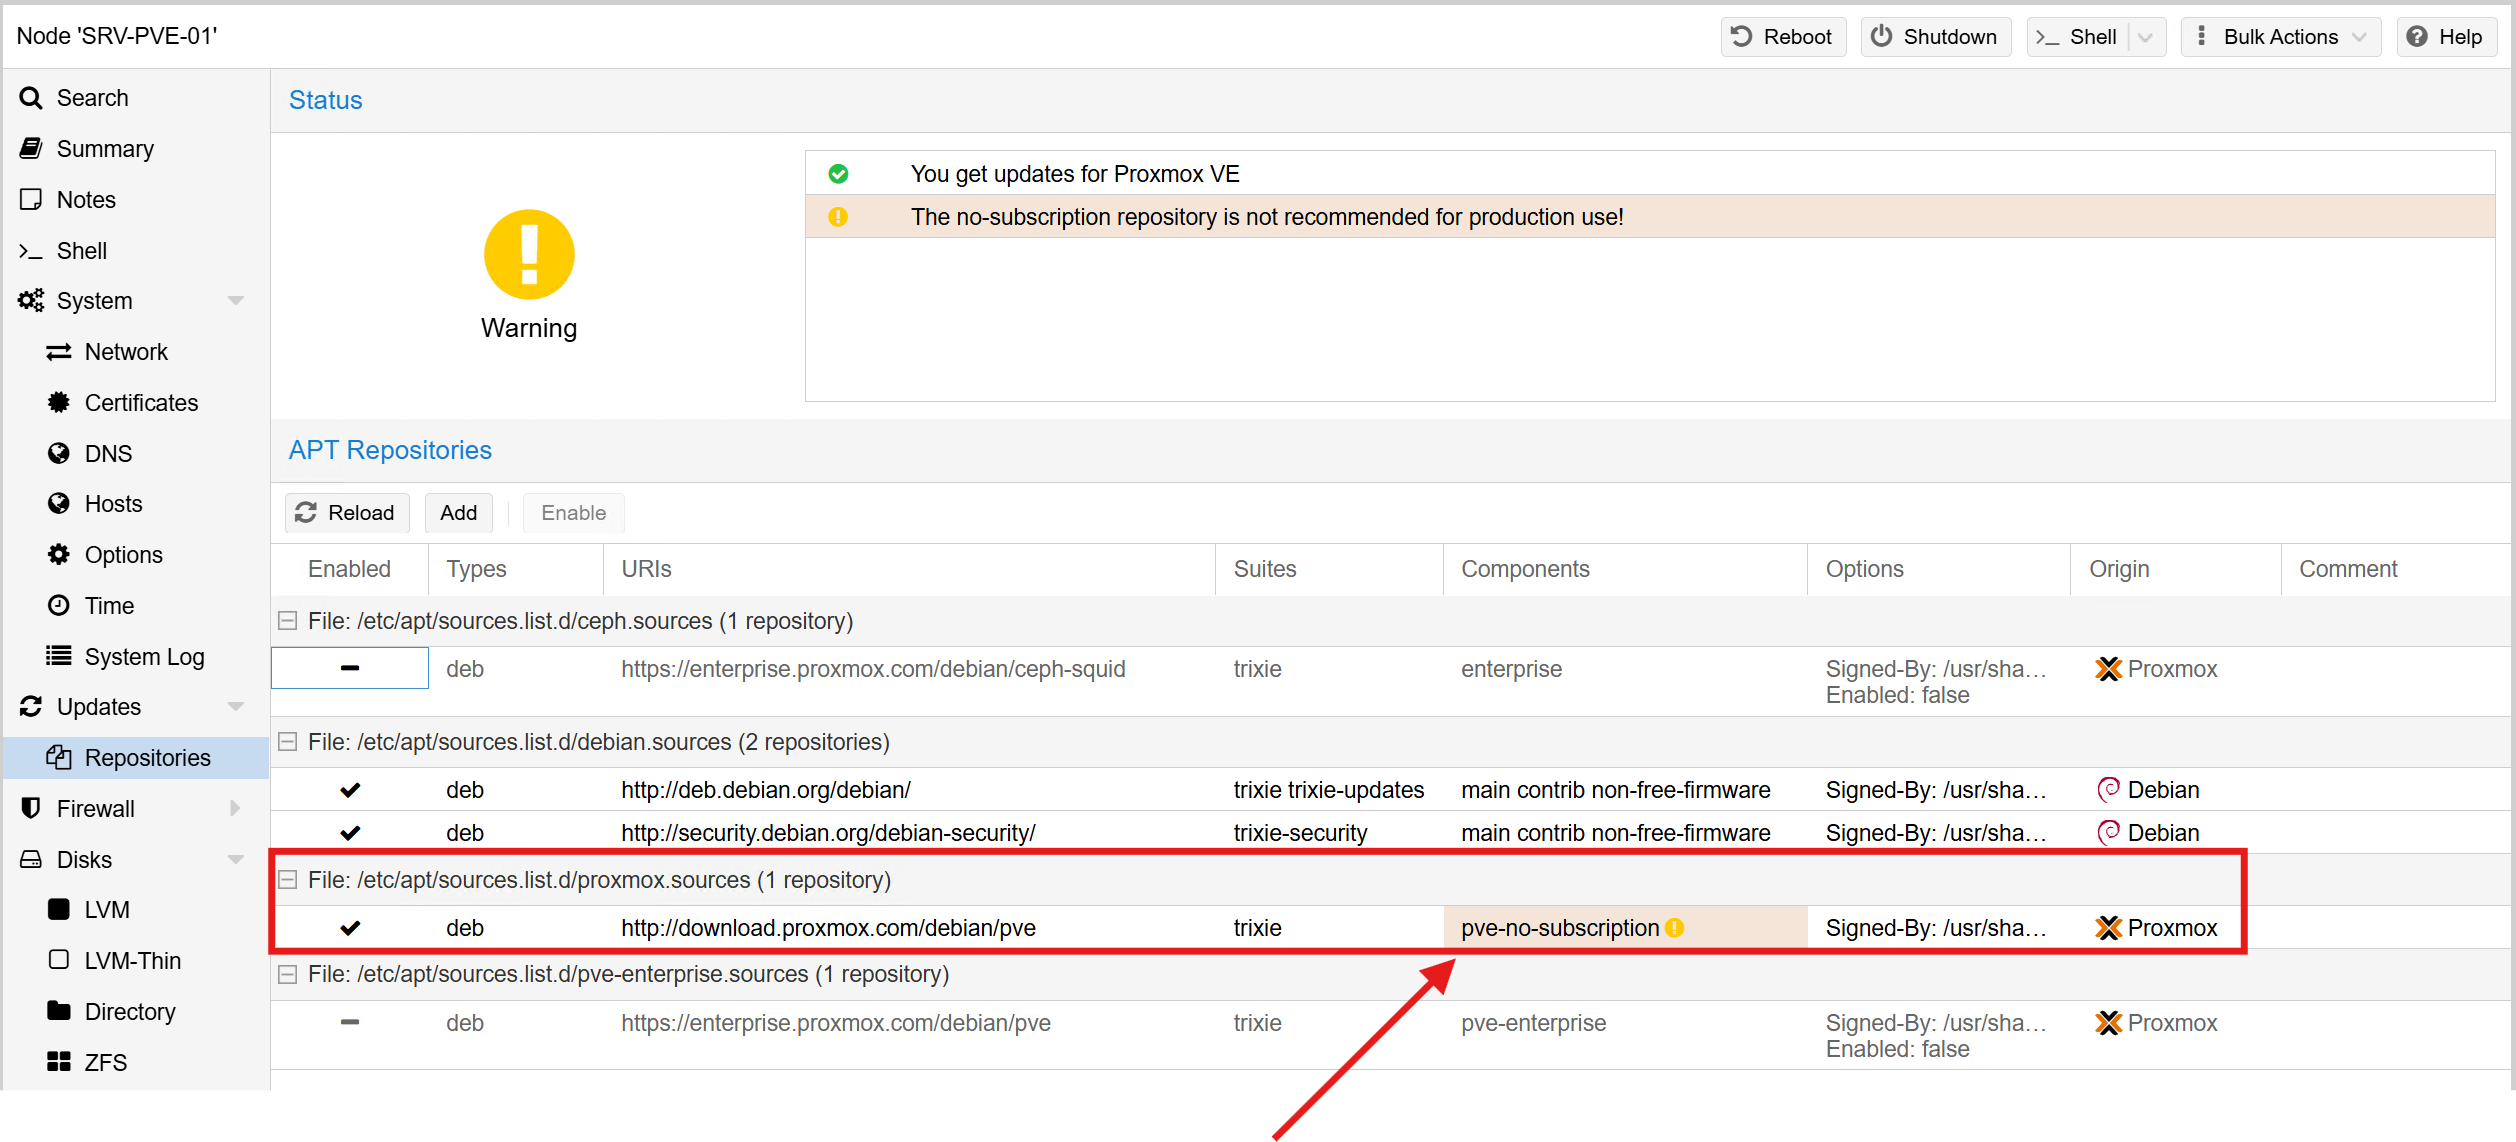
Updates and Repository Configuration
Proxmox is open source and fully functional without a subscription. For production environments, paid support and enterprise repositories are recommended. But for the lab, I opted to use the no-subscription repository, which still receives regular feature and security updates.
After the initial installation, I configured the package sources to ensure the host pulls from the correct repository before running a full update. This ensures the system stays secure and stable as new releases come out:
DNS Configuration (Active Directory Integration)
With Proxmox running, the next step was to integrate it into the lab’s Active Directory environment (edbradleyweb.local). At the network level, that starts with DNS.
I updated Proxmox’s network settings so that DNS queries are forwarded to my two domain controllers:
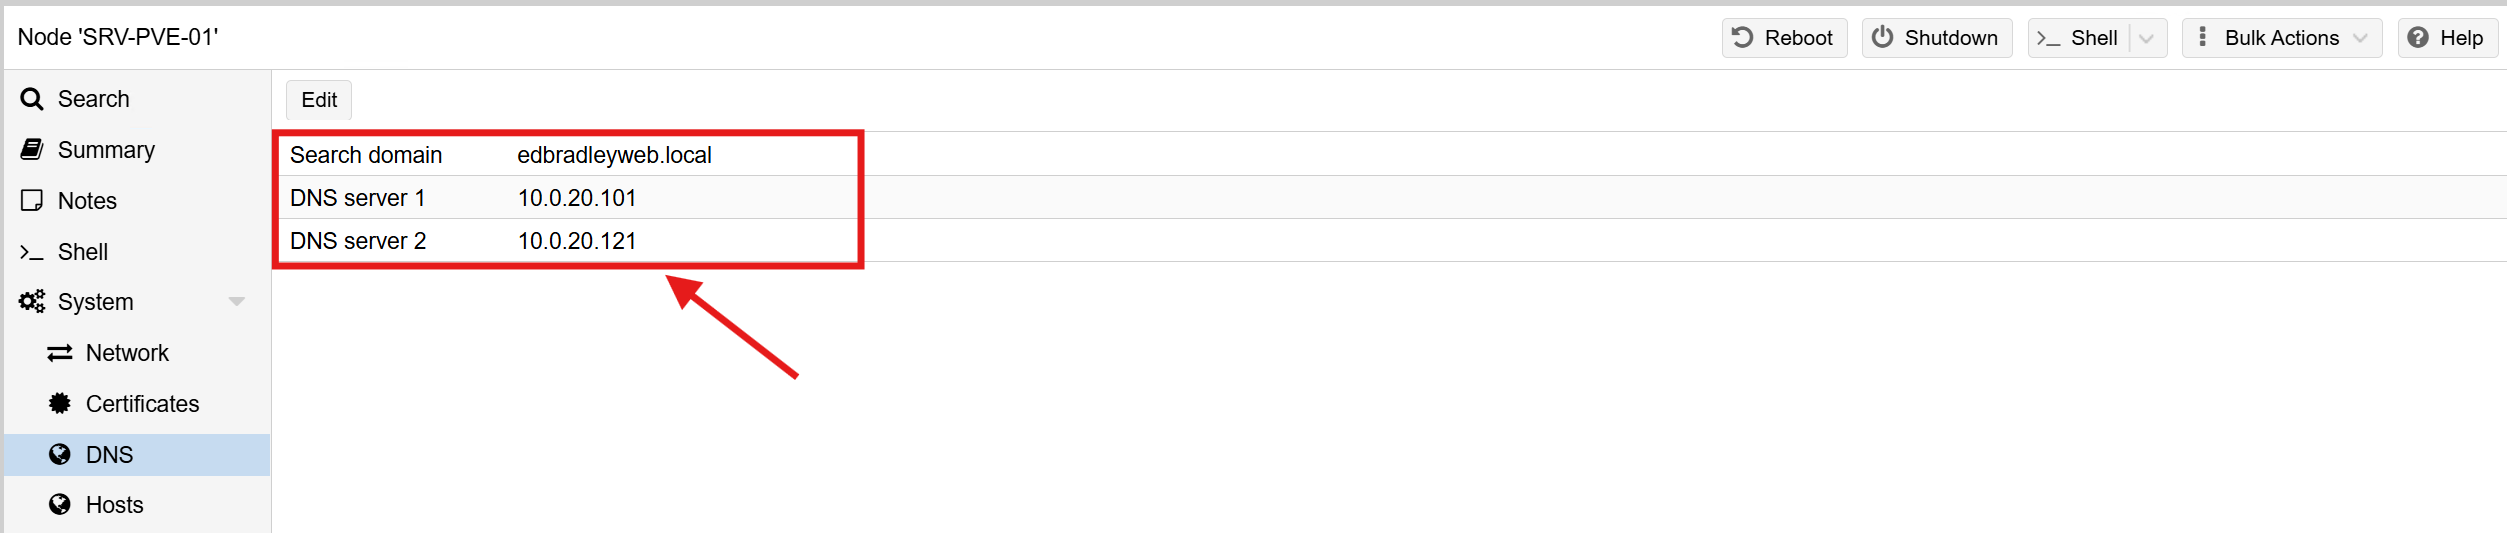
This ensures proper AD service discovery (LDAP, Kerberos, SRV records, etc.) and lays the groundwork for AD-based authentication later.
Network Time Synchronization
Accurate time is critical in any AD-joined environment. Kerberos authentication depends on it. Proxmox 9.x uses chrony for time synchronization.
I edited the chrony.conf file to point to the two domain controllers by FQDN:
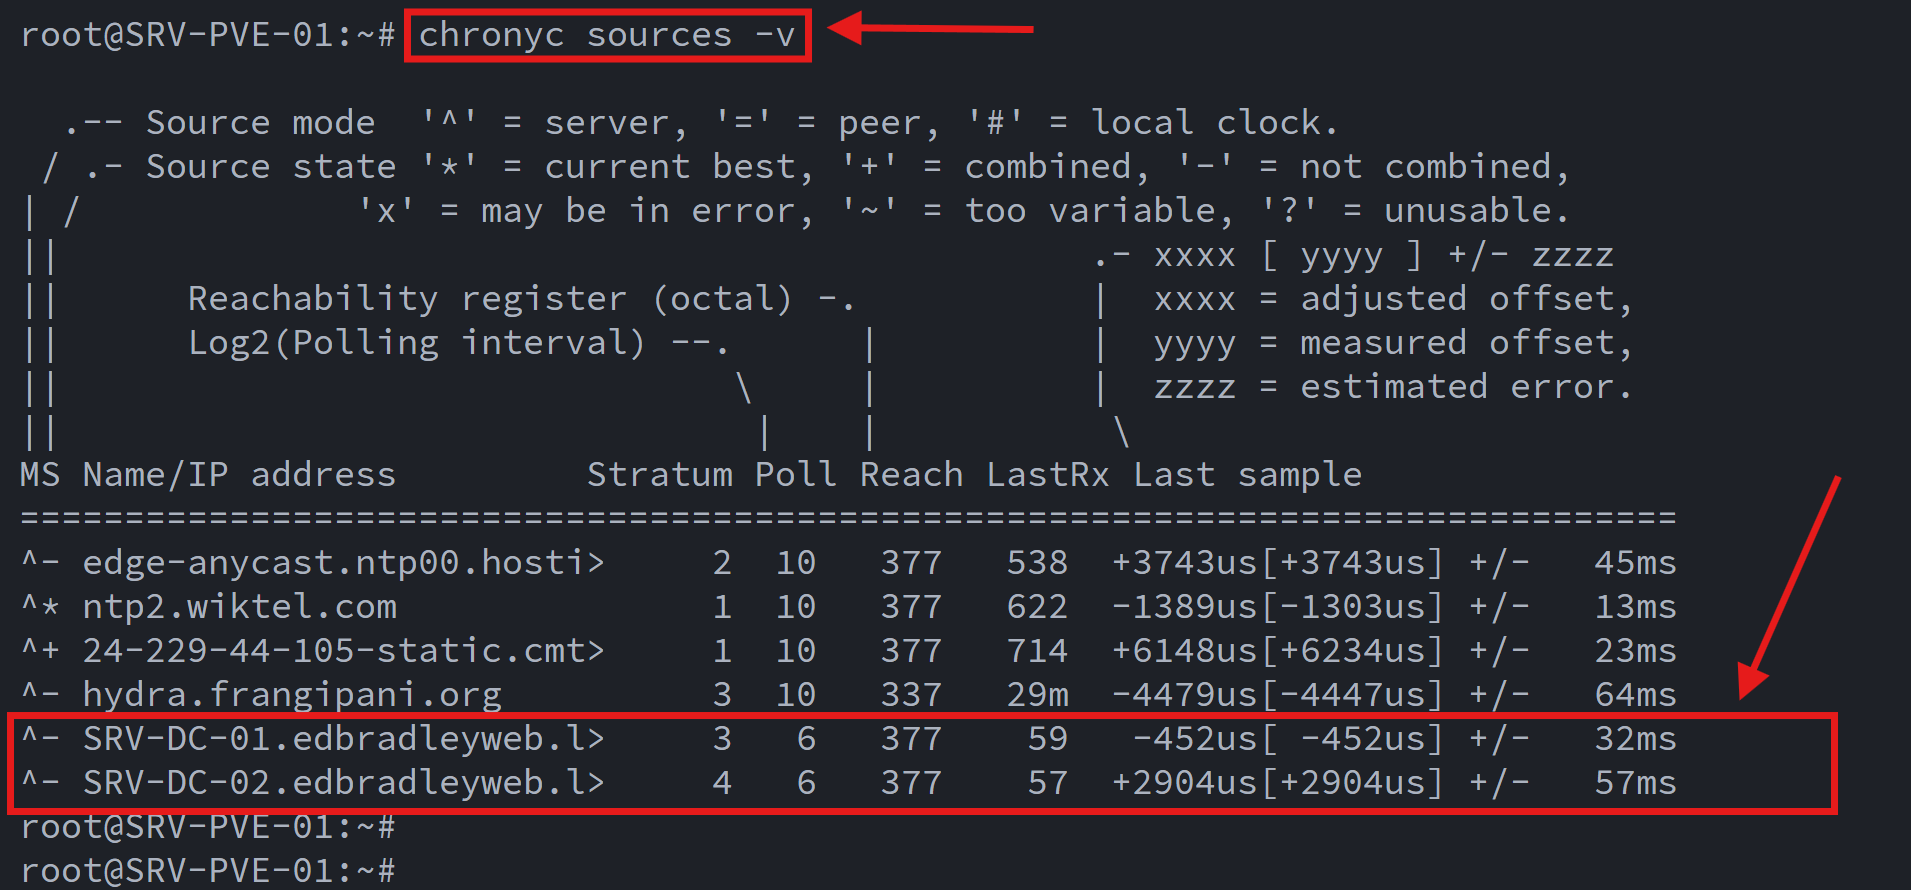
With time now synchronized across the environment, Proxmox meets Kerberos requirements and maintains consistent timestamps for logs, VM snapshots, and SOC-related tooling.
Active Directory User/Group Integration
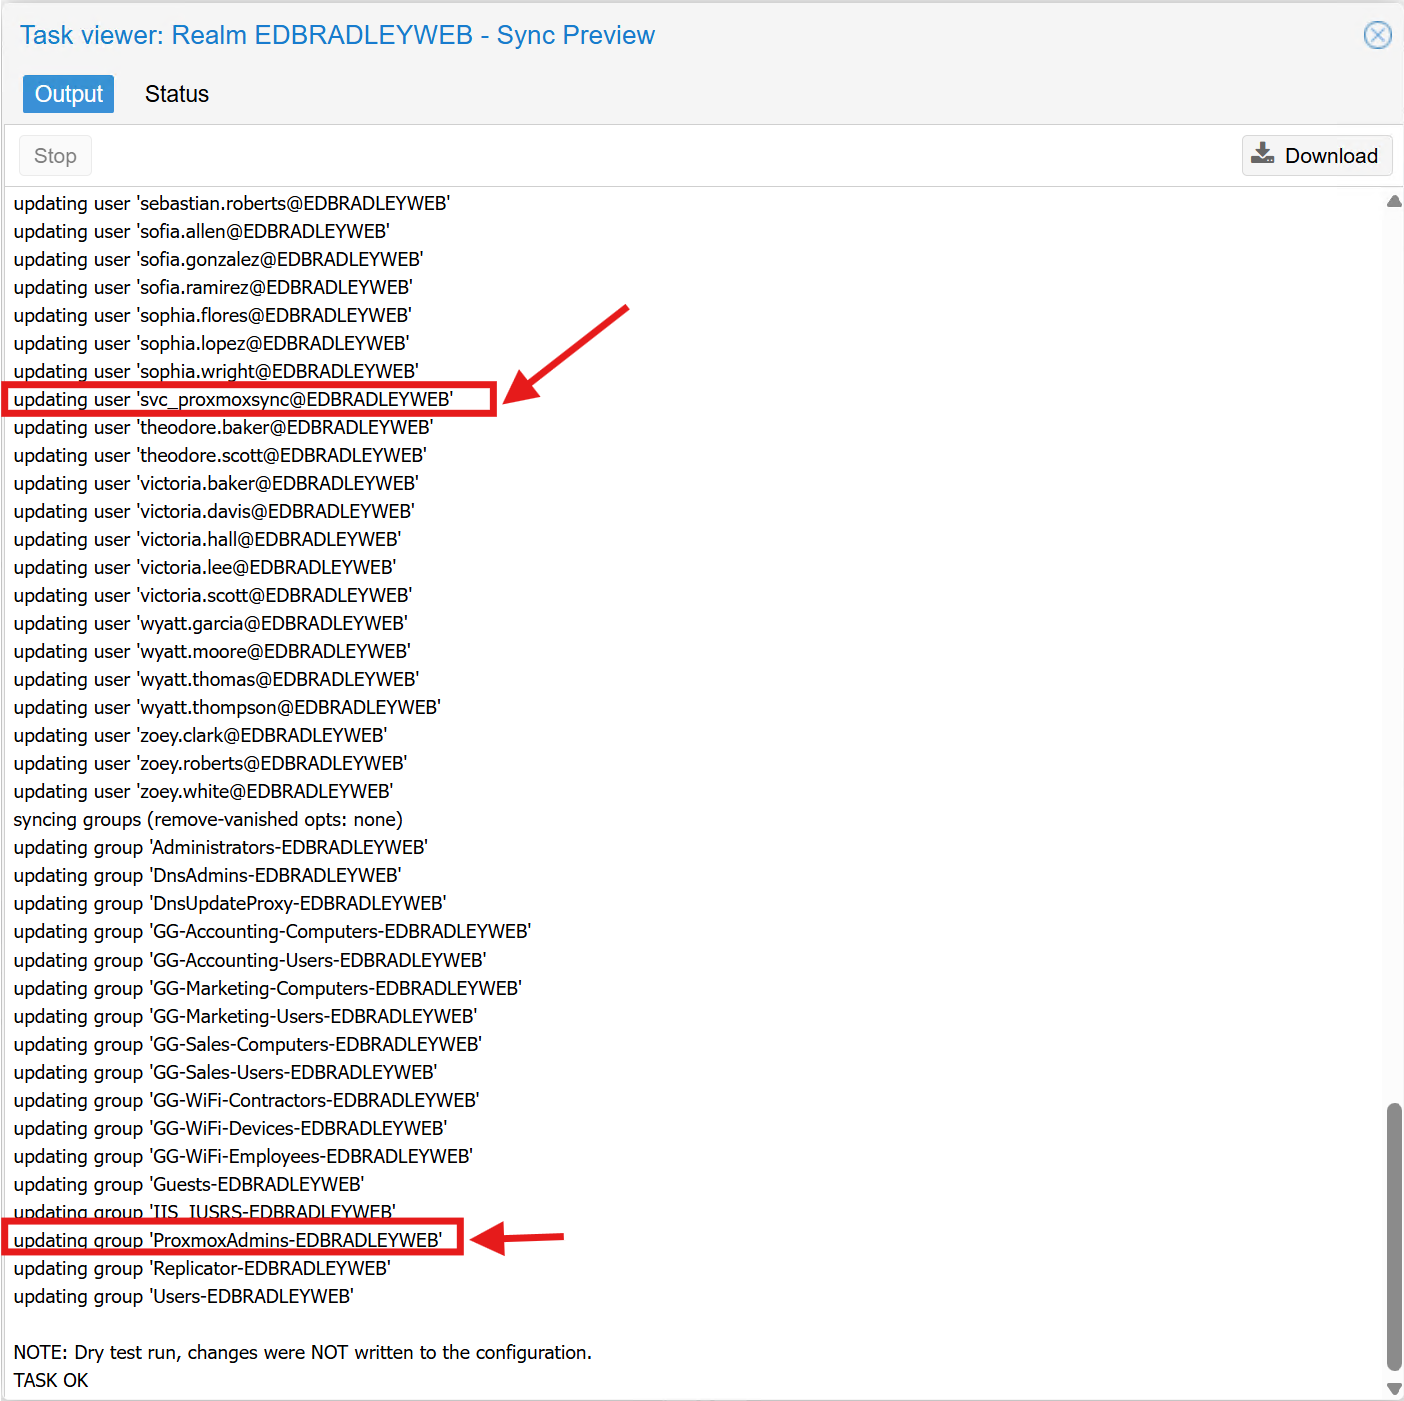
Proxmox makes it straightforward to integrate with Active Directory using Realms. After creating a realm for the domain, Proxmox can authenticate users through AD and even import groups for role-based access control.
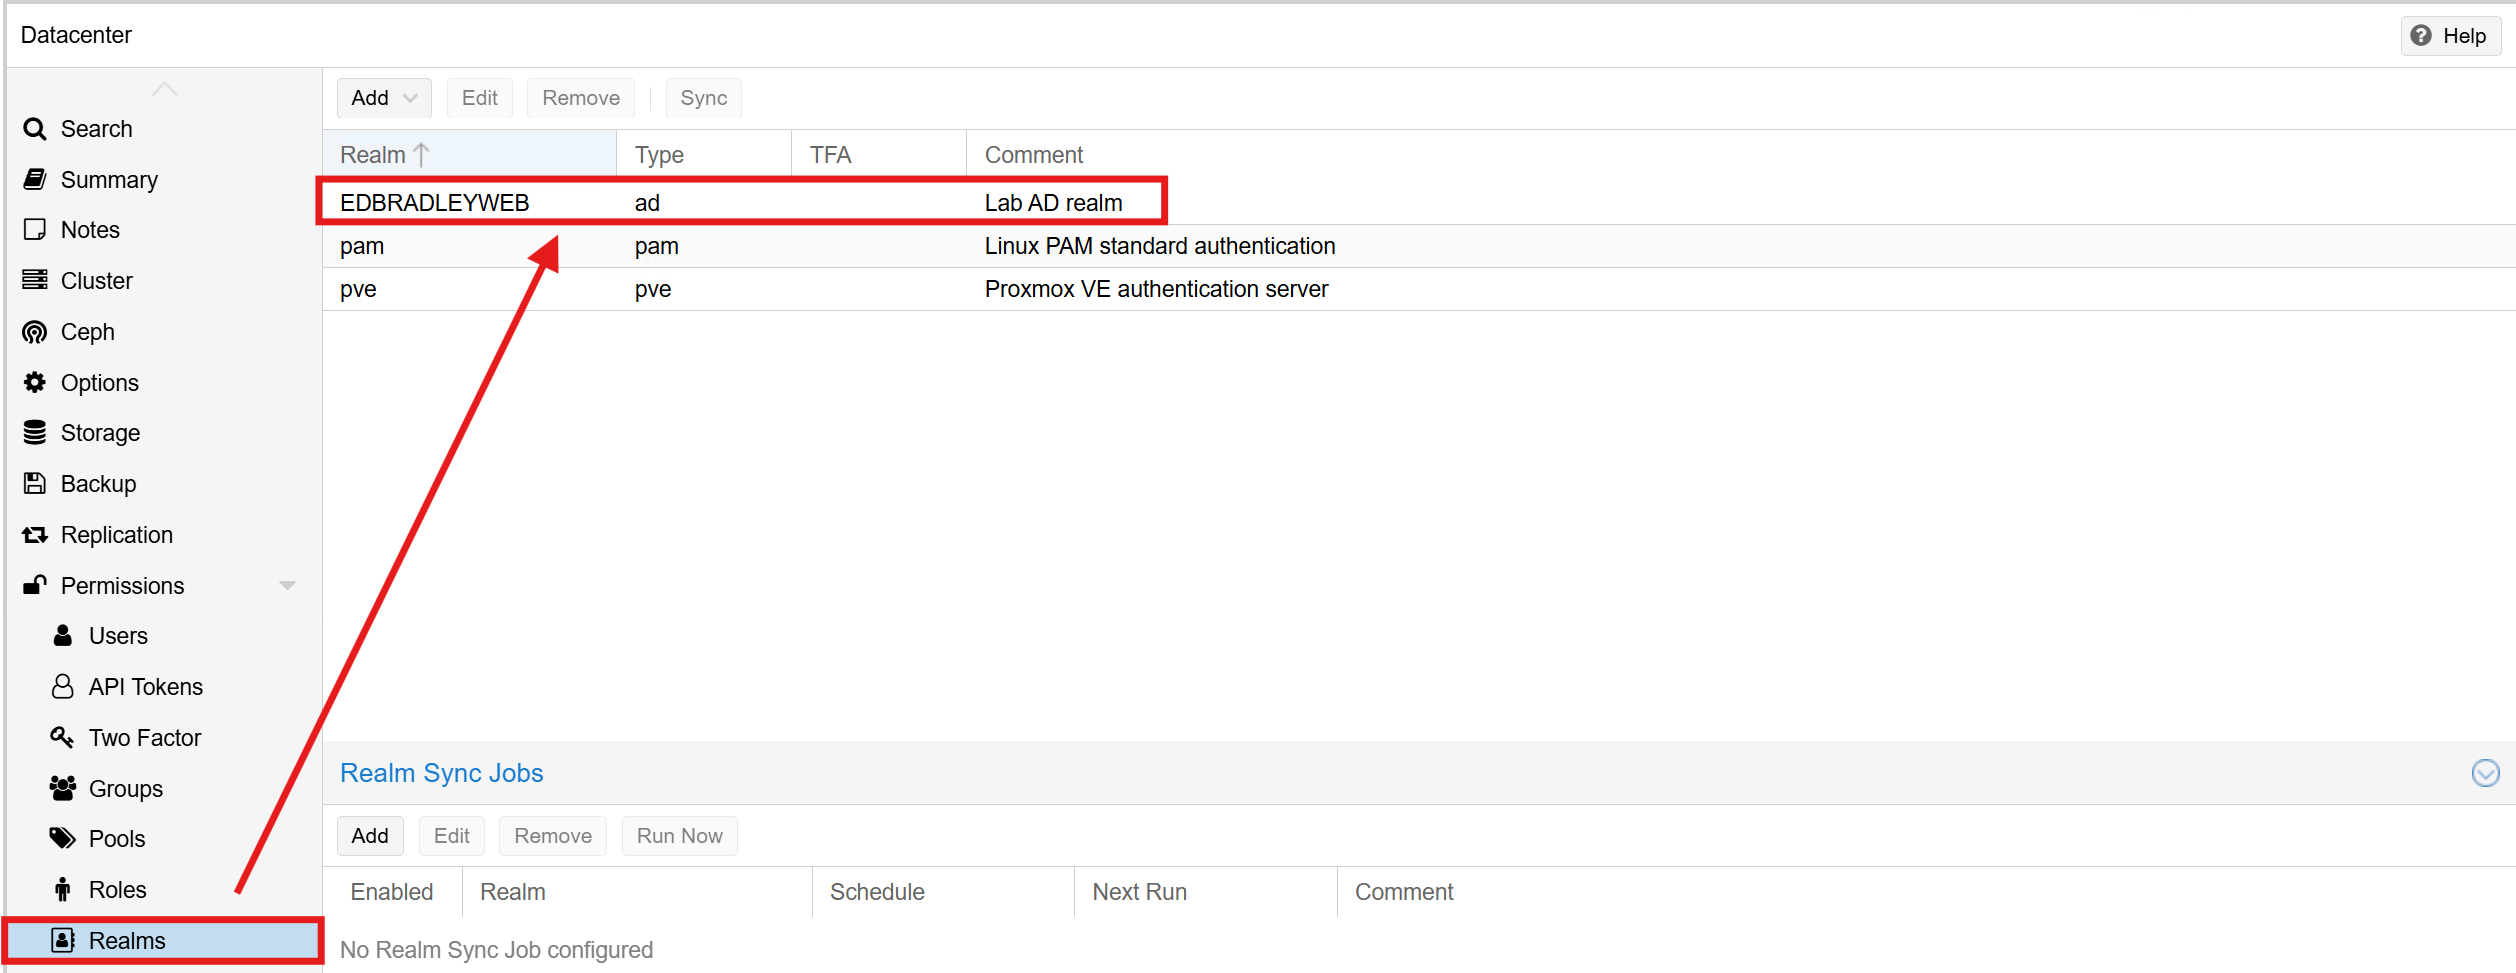
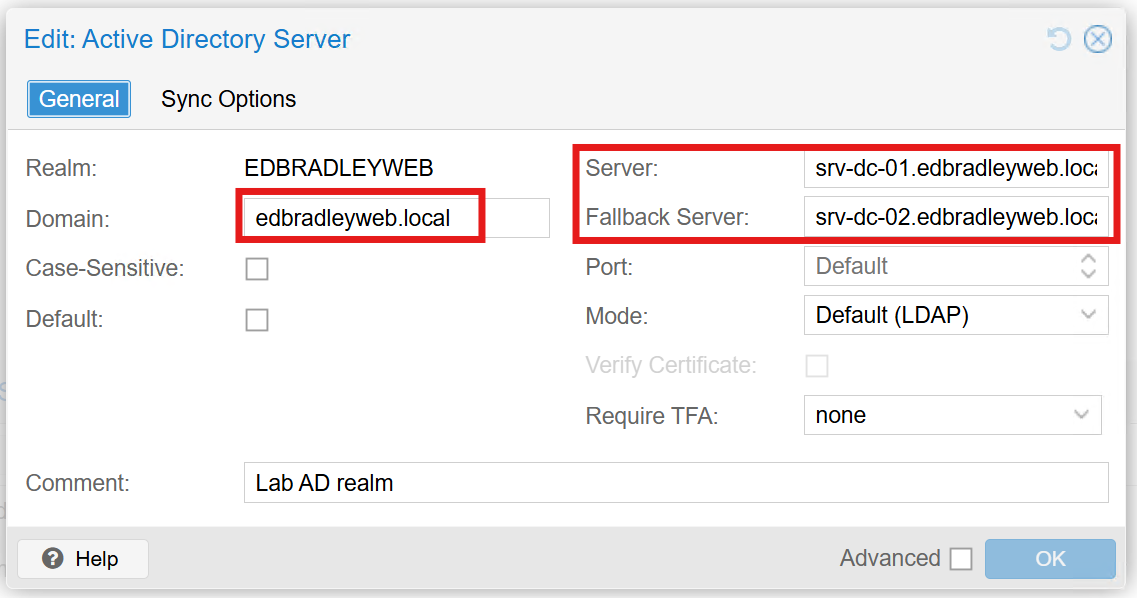
To support this, I created the following in my AD domain:
- Group:
ProxmoxAdmins(used to grant Proxmox administrative access) - Service Account:
svc_proxmoxsync(used for directory synchronization)
Important: Proxmox does not support spaces in user or group names. My initial naming (“Proxmox Admins”, “Proxmox Sync”) caused sync failures until I renamed them.
Once configured, AD logins worked seamlessly, allowing domain accounts to access the Proxmox Web UI:
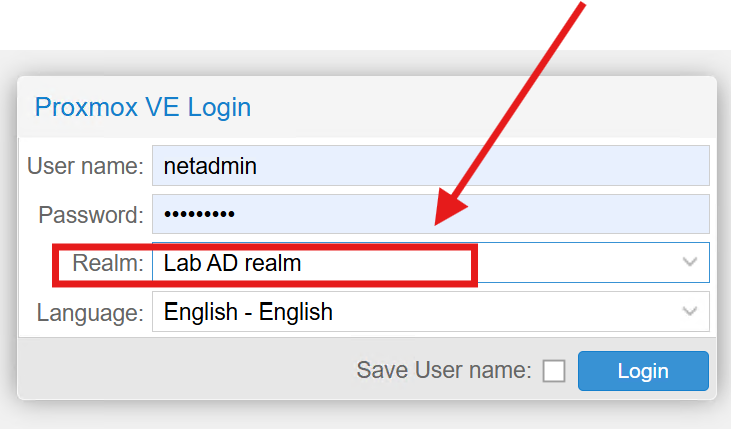
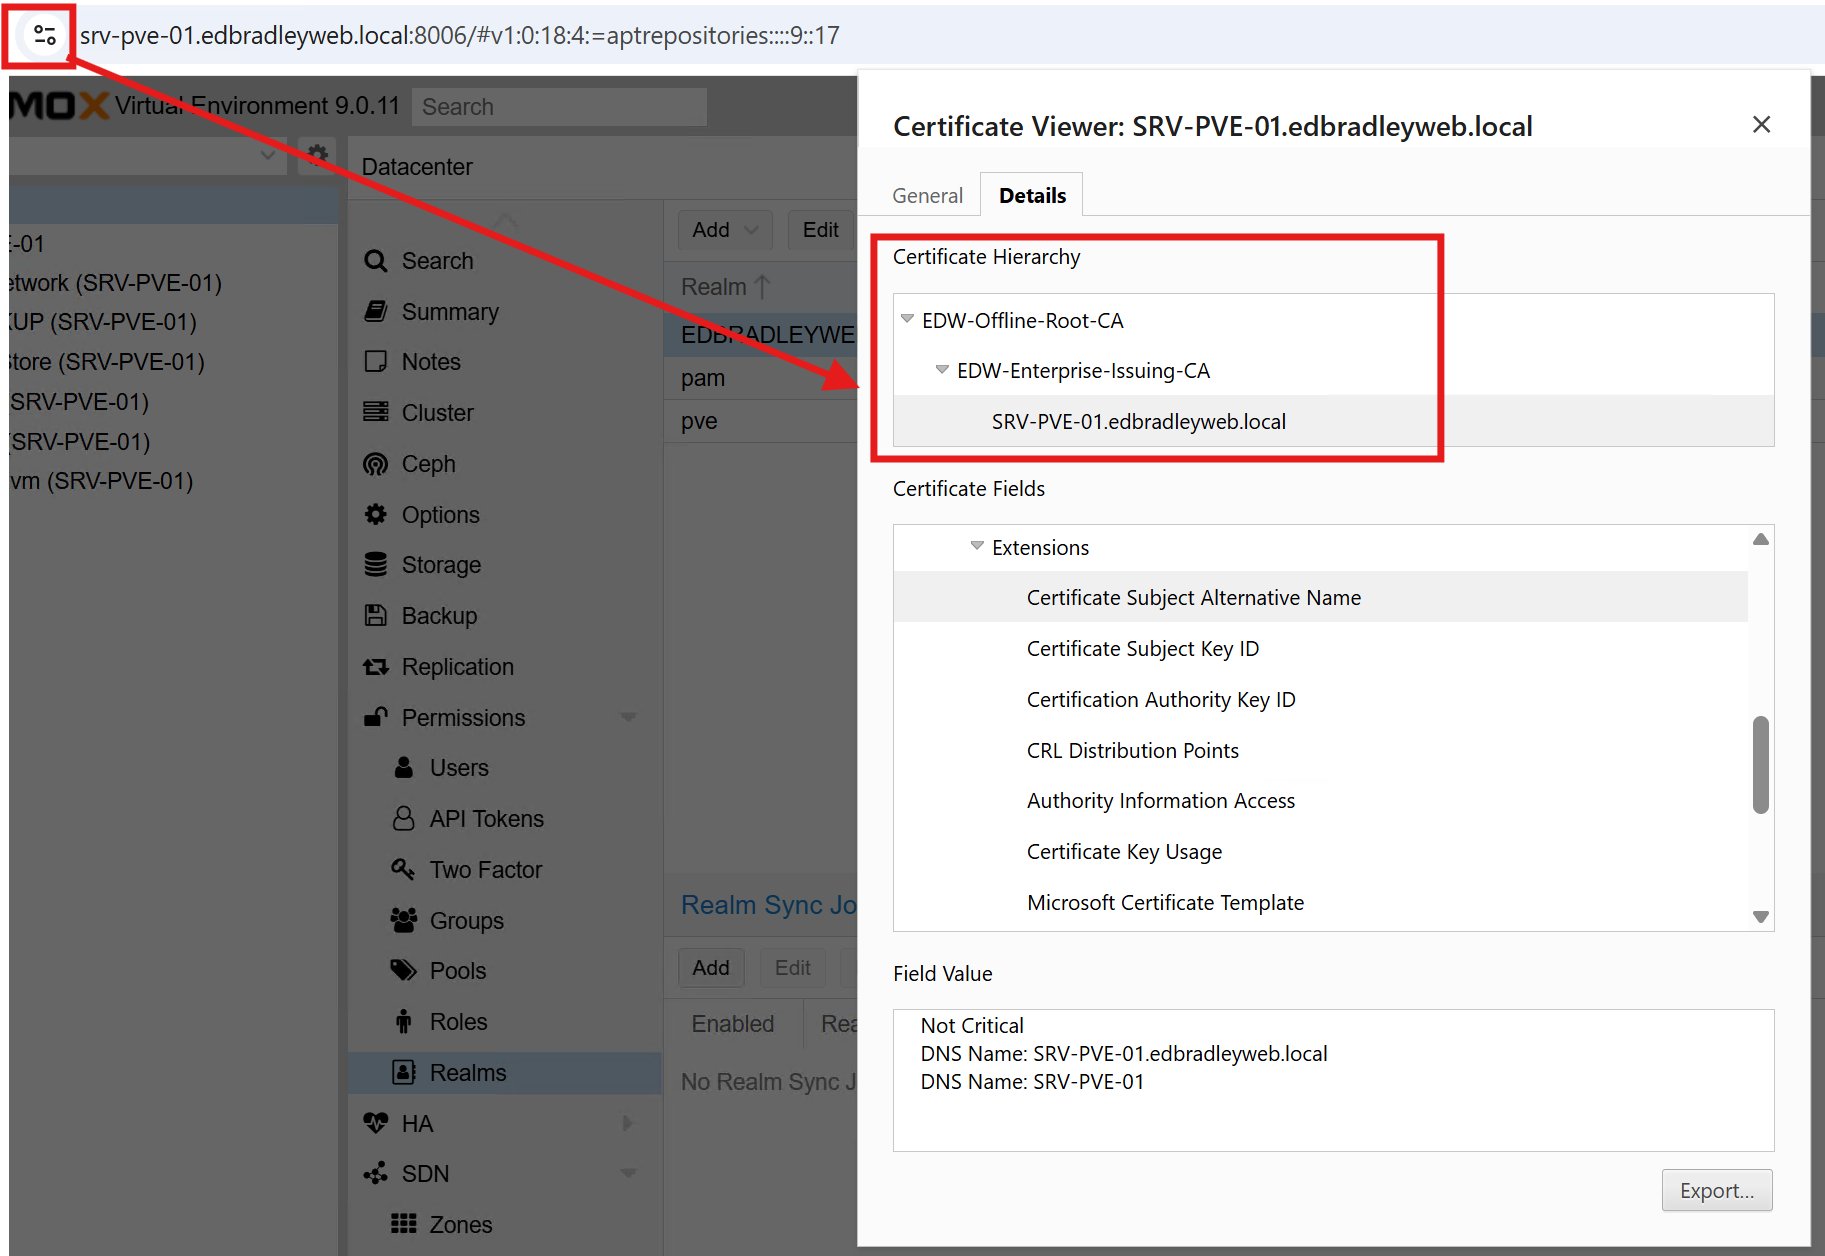
PKI Integration & HTTPS Certificate Deployment
To finalize the integration and secure the management interface, I obtained a trusted TLS certificate from the internal Certificate Authority (CA) established earlier in the lab build.
Steps included:
- Generating a CSR on the Proxmox server:
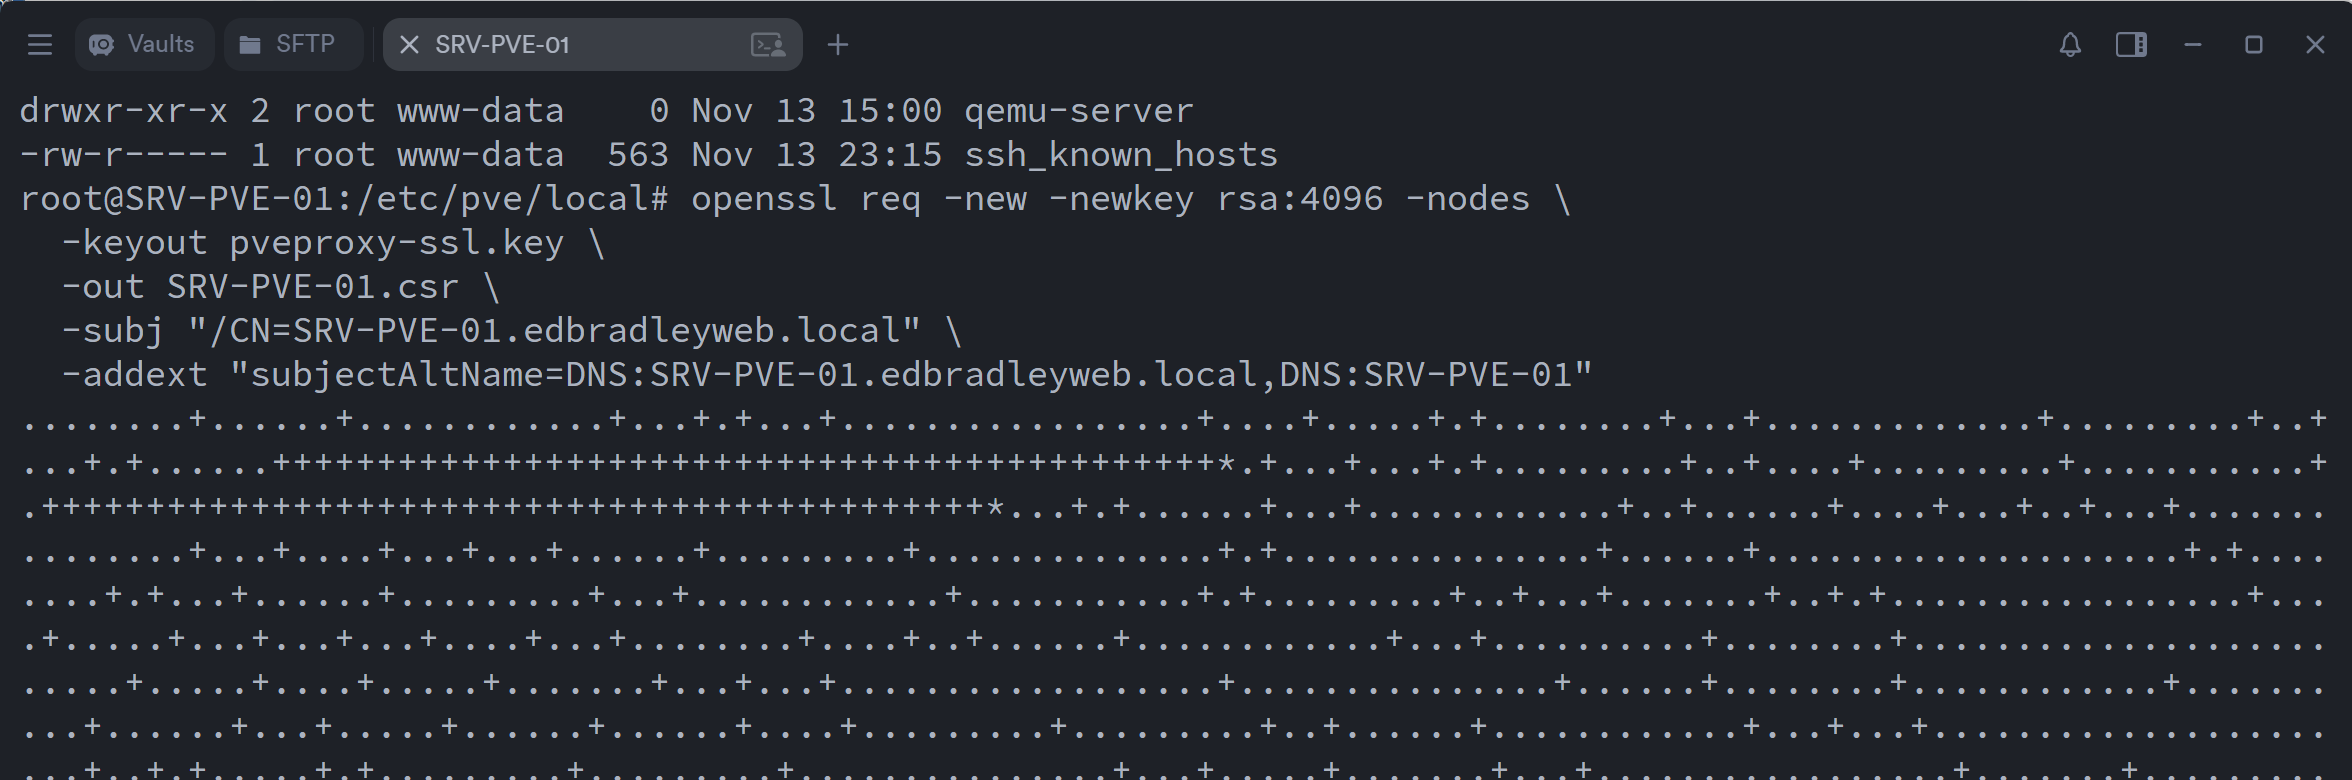
- Submitting it to the internal CA & Exporting the issued certificate:
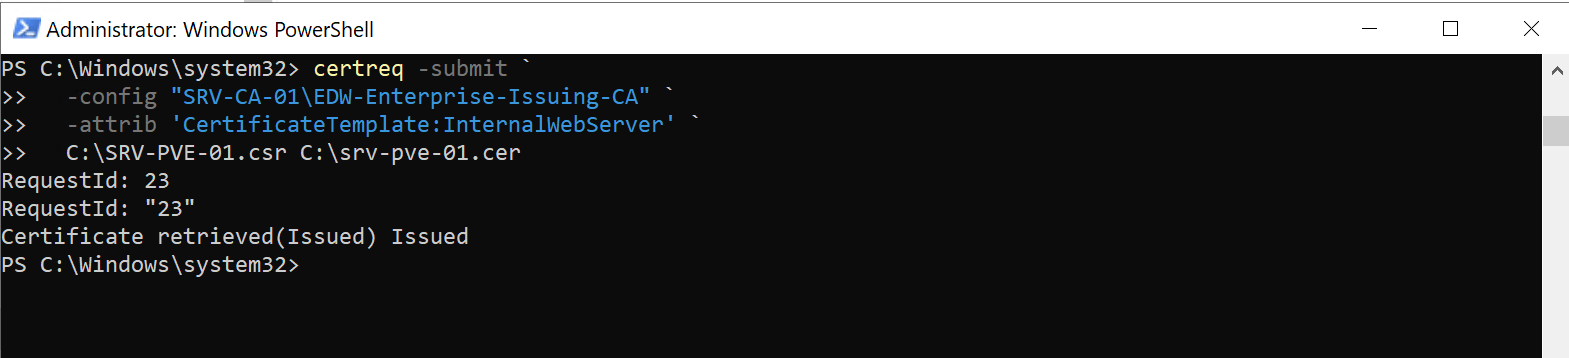
- Installing and activating it on the Proxmox host:
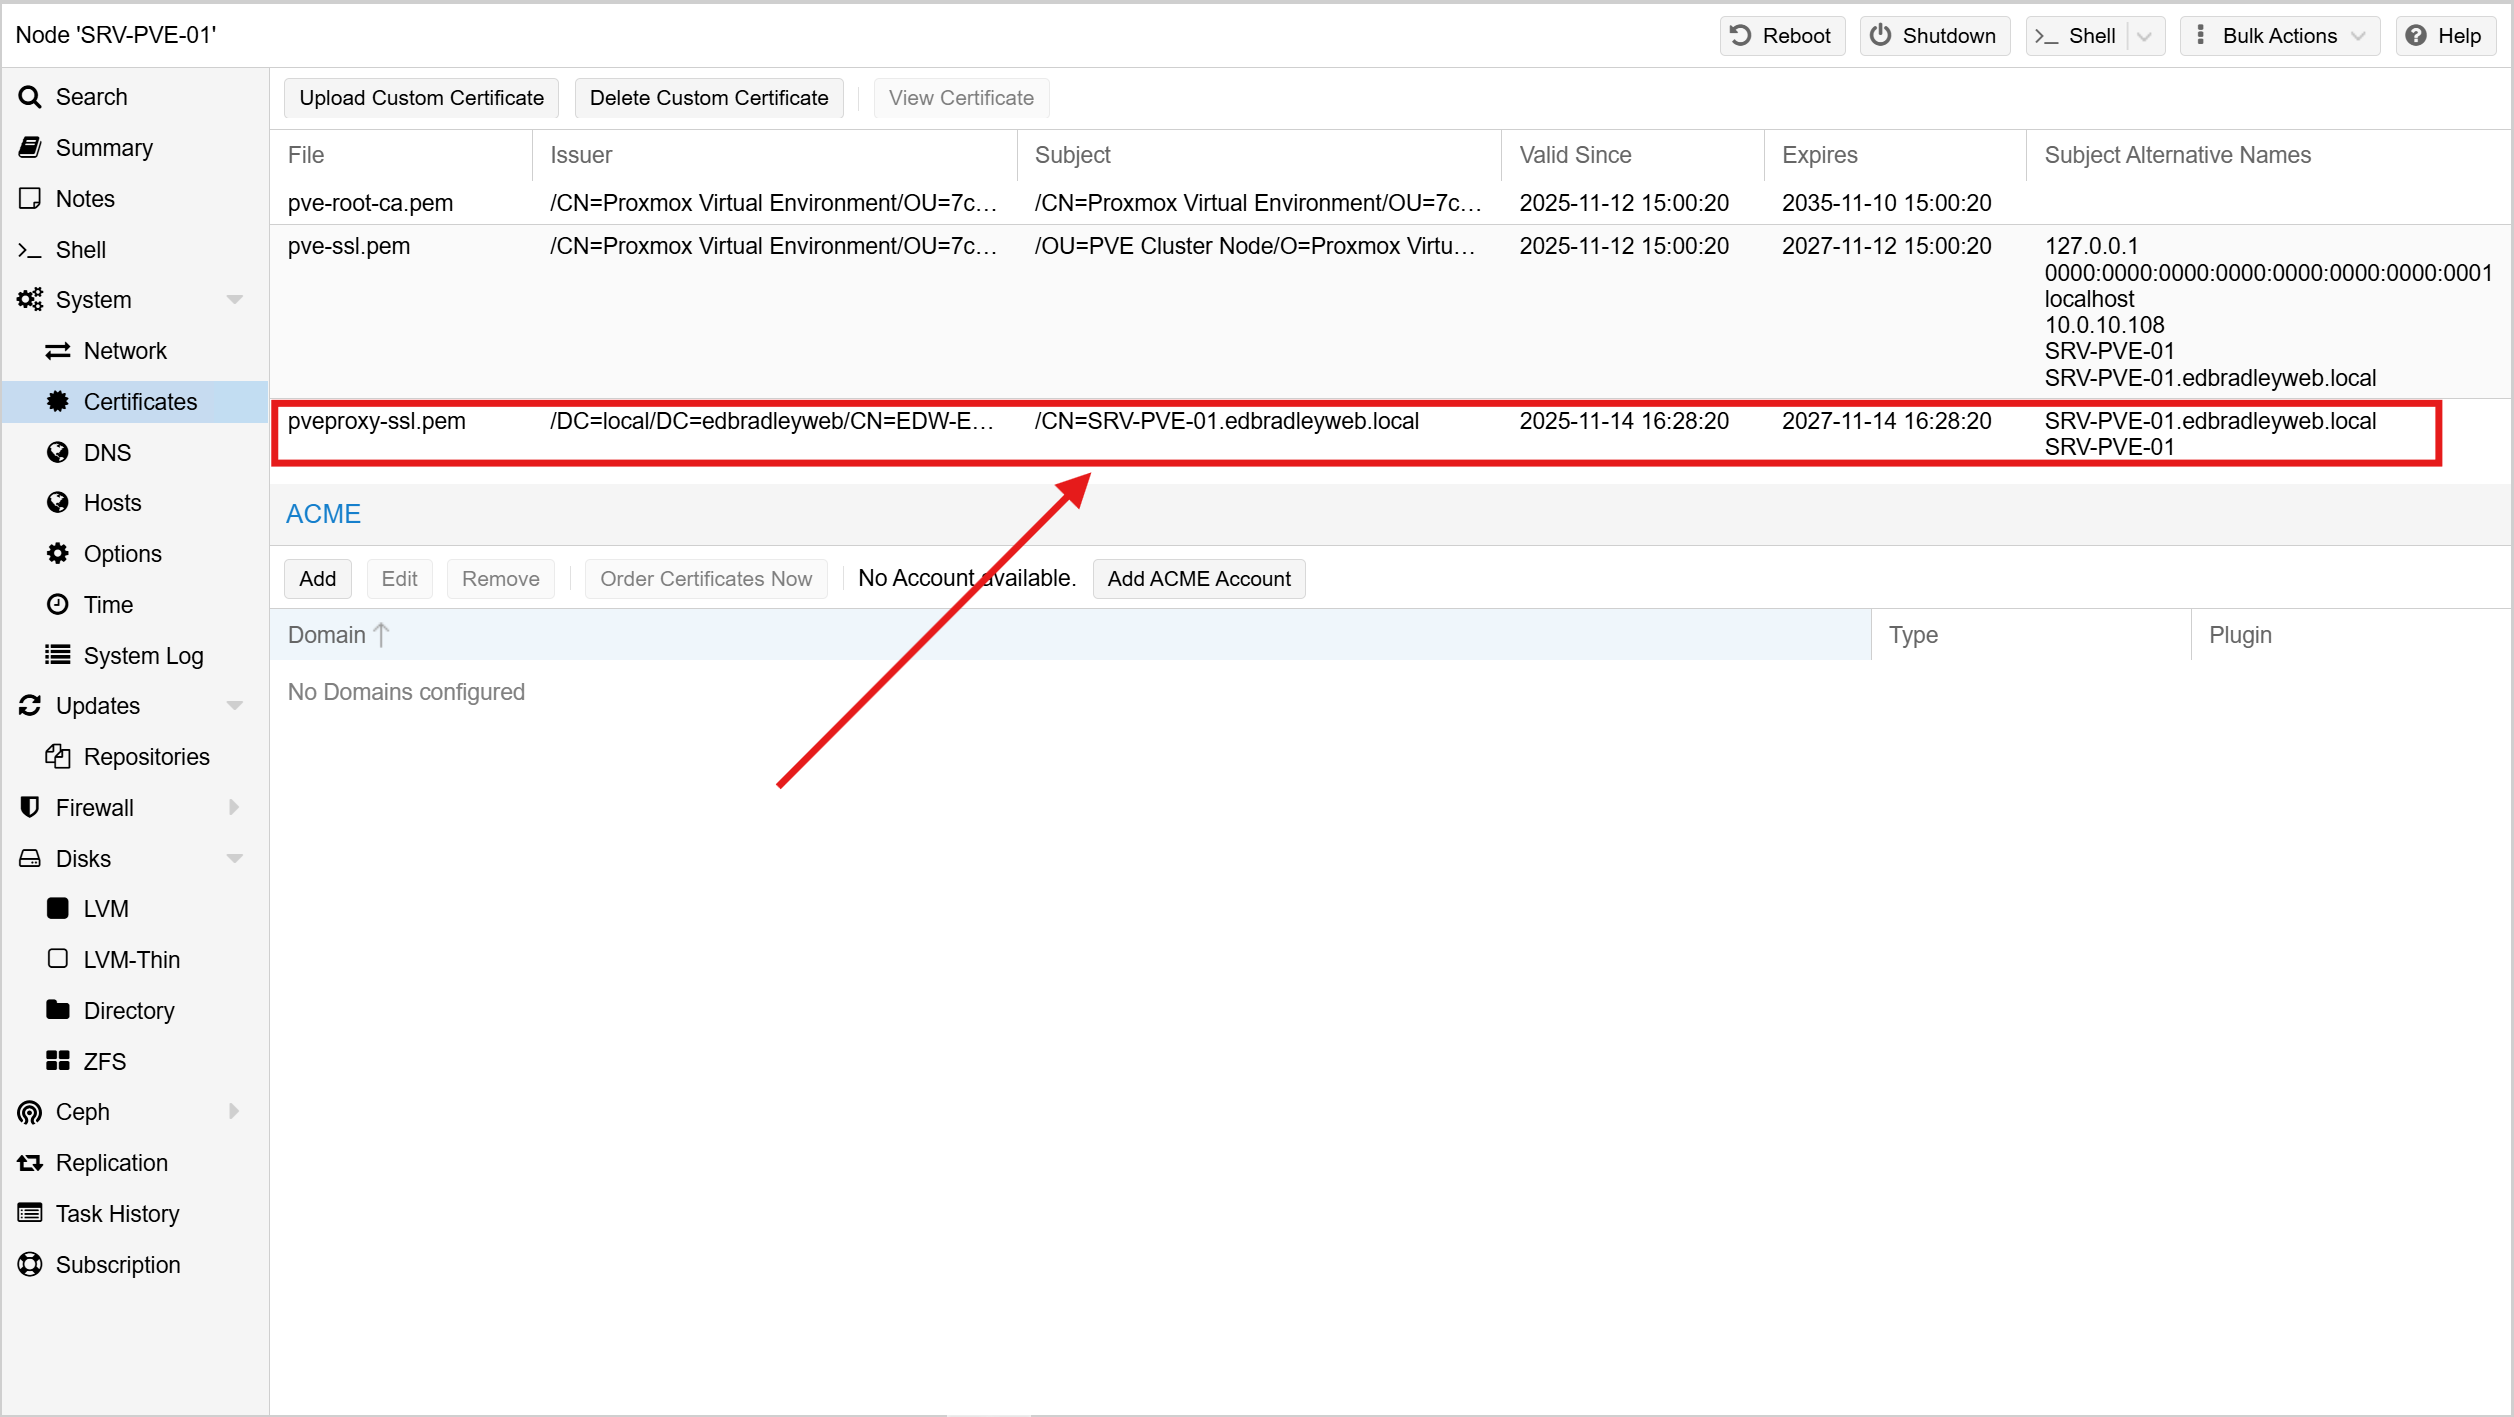
With this in place, any domain-joined workstation now sees the Proxmox Web UI (https://srv-pve-01.edbradleyweb.local) as fully trusted! No browser warnings, no untrusted certificates, and better alignment with enterprise security expectations:
Summary
This phase of the project focused on building the foundation of the Mini SOC by deploying Proxmox VE on a dedicated Dell workstation. I structured the host’s storage, enabled lab-appropriate update repositories, and integrated Proxmox with Active Directory for DNS, time synchronization, authentication, and PKI. With a trusted certificate installed and AD-based logins working, the hypervisor is now securely embedded into the lab’s identity and security ecosystem, ready to host the full SOC stack!
OpenSearch Server Deployment
To kick off the deployment of the Mini SOC components on the Proxmox hypervisor, I started with OpenSearch (https://opensearch.org/). This server will warehouse and index the collected data from the other component servers. In this phase of the project, I:
- Created the VM
- Installed the Operating System (Ubuntu Server 24.04 LTS)
- Added a separate data disk
- Installed & configured OpenSearch as a single-node, lab-friendly, indexer
VM Creation:
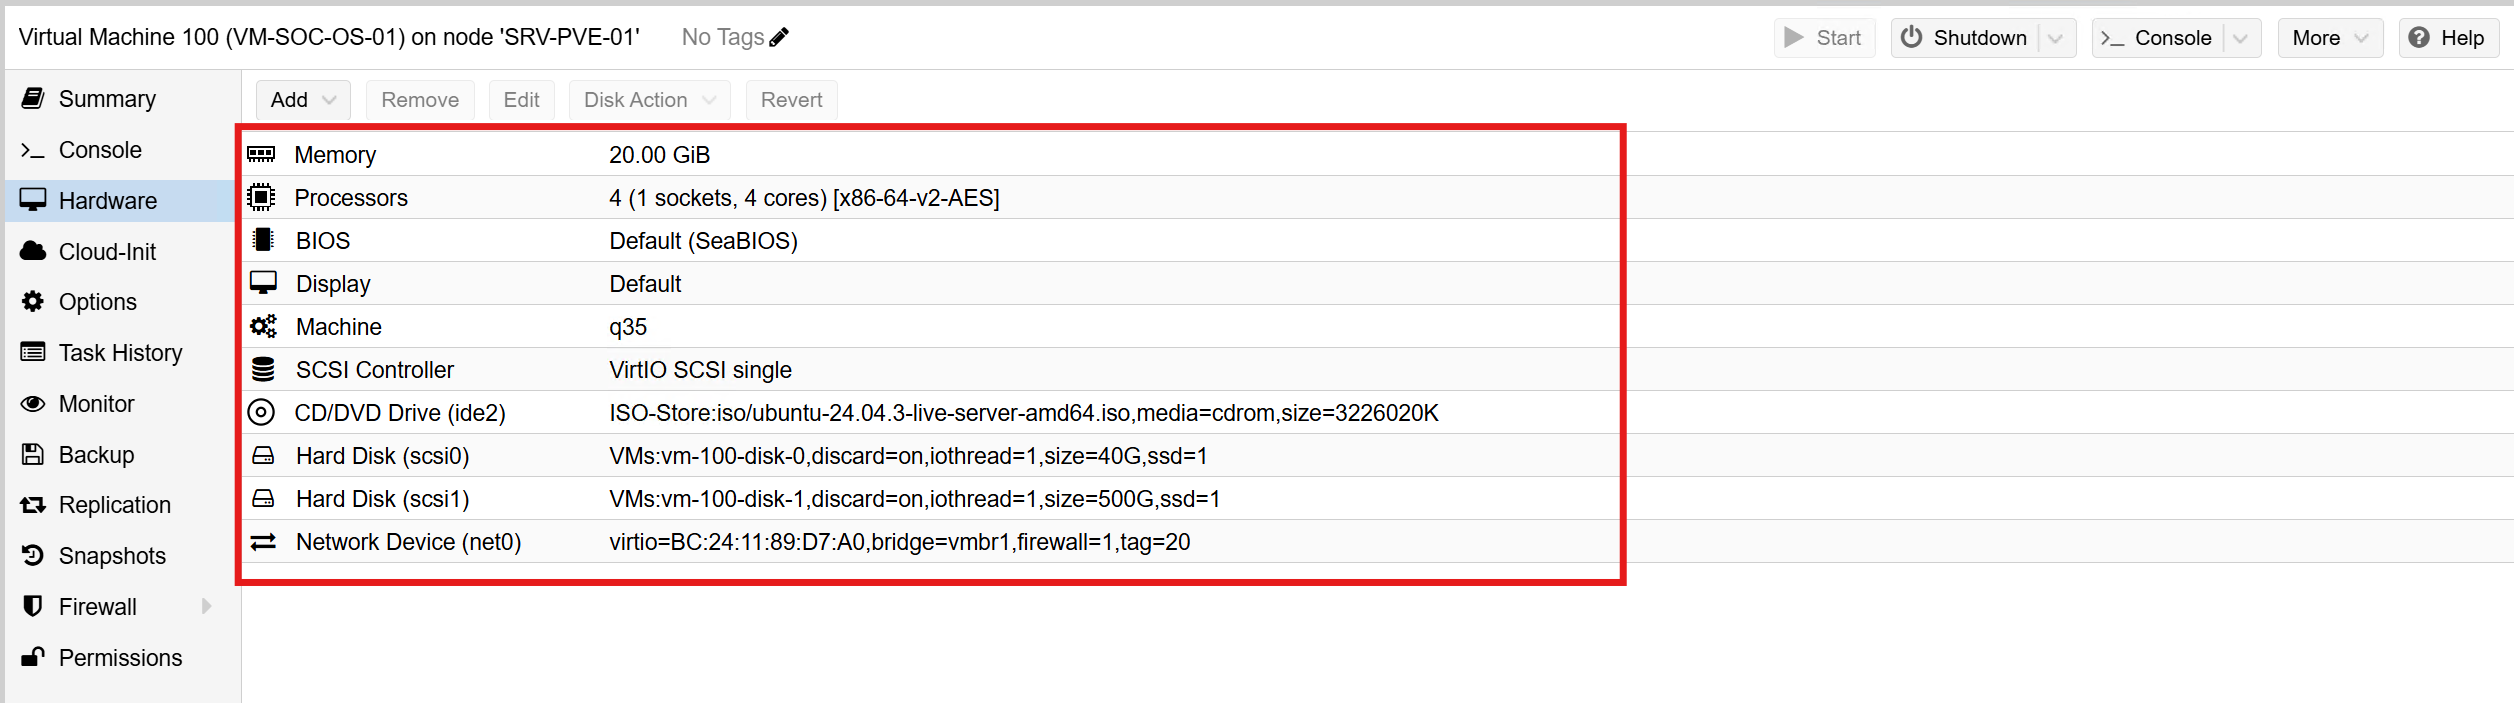
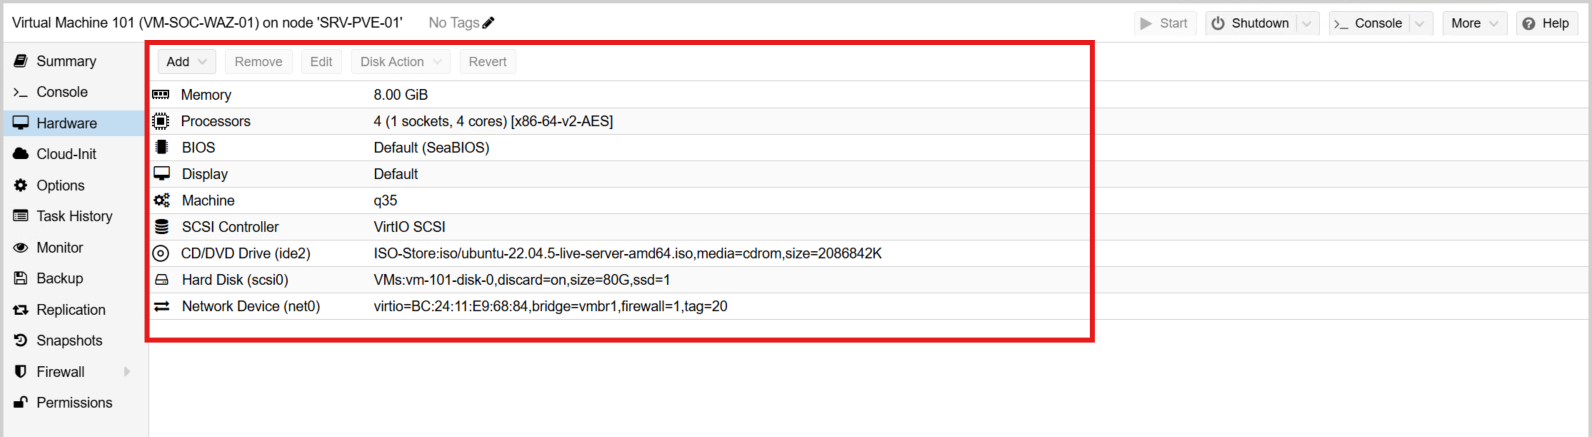
I created a new Proxmox VM with the following specifications:
- VM Name: VM-SOC-OS-01
- RAM: 20GB
- CPU: 1 Socket with 4 Cores
- BIOS: SeaBIOS (Default)
- Machine Type: q35
- Hard Drive #1: 40GB
- Hard Drive #2: 500GB
- Network: vmbr1 (Tagged as VLAN 20)
I then booted the server and installed Ubuntu Server. I set up the host name and IP address as follows:
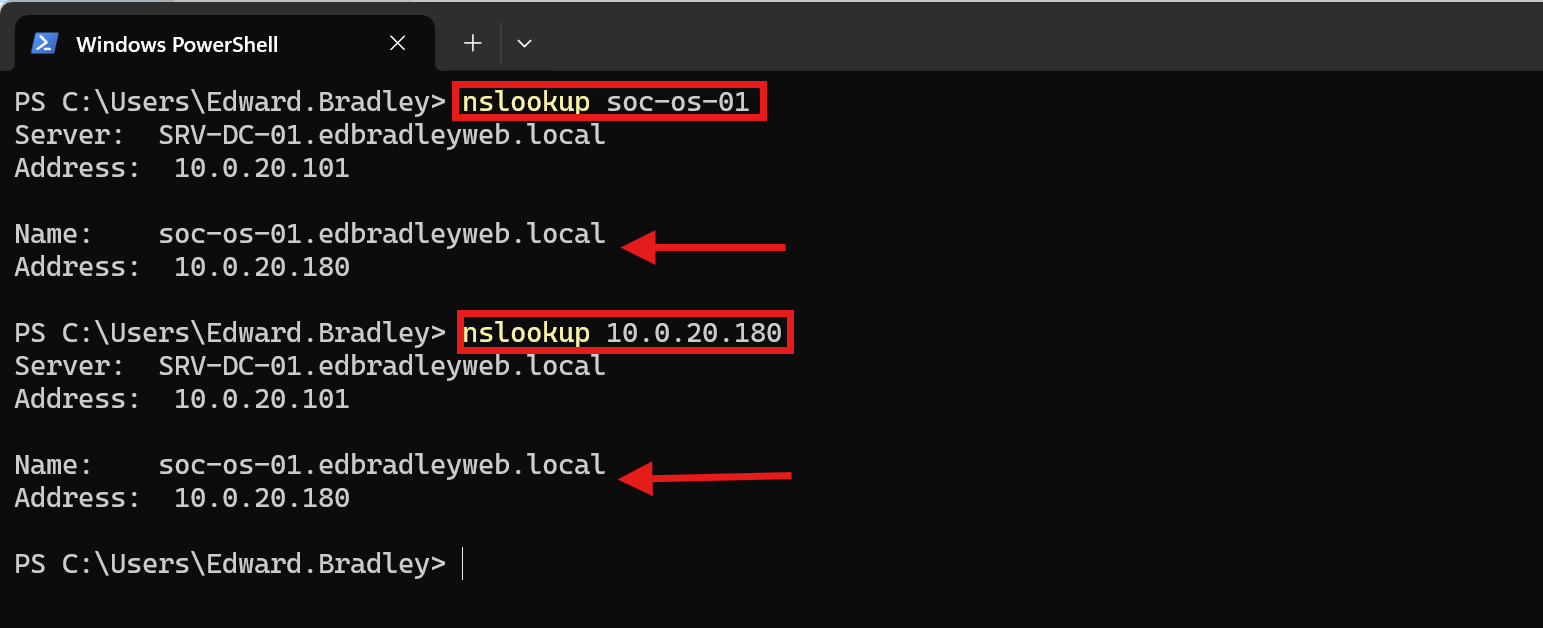
Host Name: SOC-OS-01 (soc-os-01.edbradleyweb.local)
IP Address: 10.0.20.180/24
DNS A and PTR records were created on the domain controllers to reference the new server:
OpenSearch Installation:
With DNS and Internet access in place, I entered commands to update the APT repository list to include OpenSearch. I then downloaded and installed the software package:
sudo -i  # become Root

mkdir -p /usr/share/keyrings

wget -qO - https://artifacts.opensearch.org/publickeys/opensearch.pgp \
  | gpg --dearmor \
  | tee /usr/share/keyrings/opensearch-keyring.gpg >/dev/null

cat << 'EOF' >/etc/apt/sources.list.d/opensearch-2.x.list
deb [signed-by=/usr/share/keyrings/opensearch-keyring.gpg] https://artifacts.opensearch.org/releases/bundle/opensearch/2.x/apt stable main
EOF

apt update
apt install -y opensearch
With OpenSearch initially installed, I made some configuration changes to suit the environment:
I adjust the Virtual Memory (Java) allocated to OpenSearch:
sudo -i # become Root

nano /etc/opensearch/jvm.options

# adjust Virtual Memory to 12GB
-Xms12g
-Xmx12g
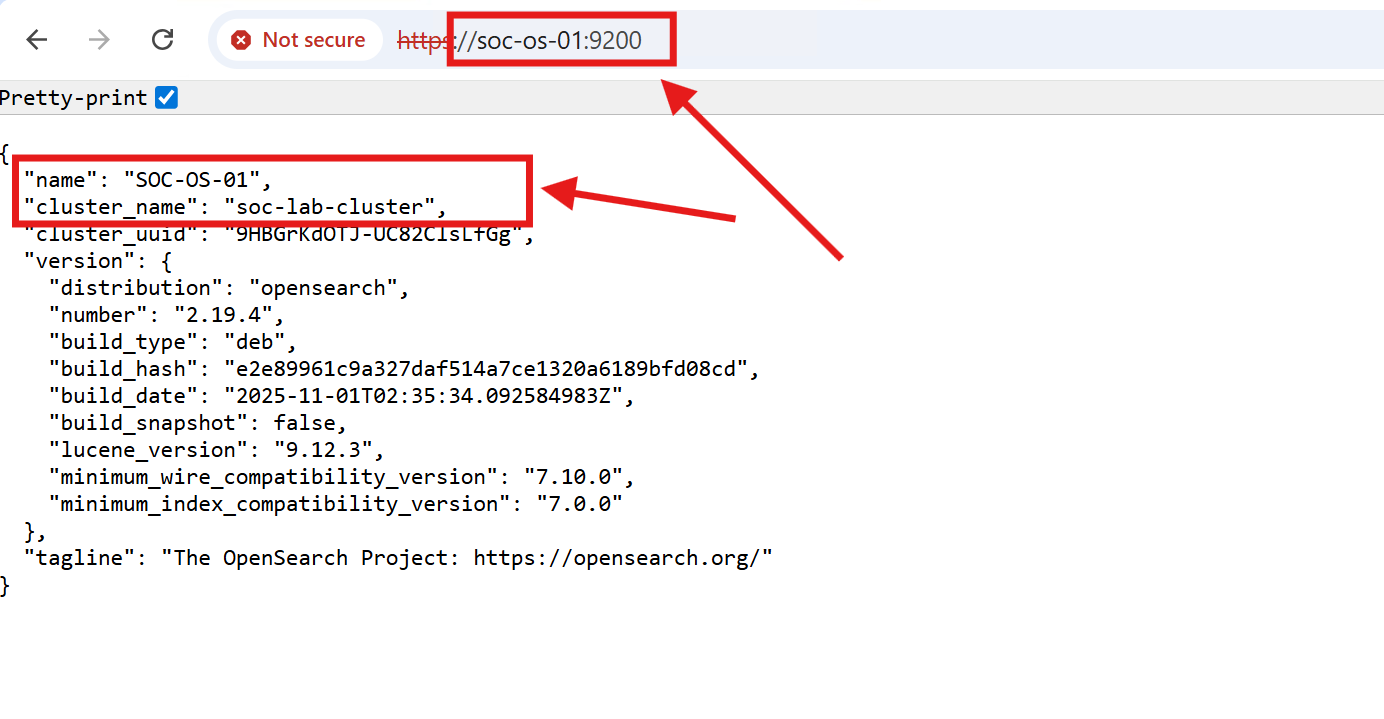
I configured OpenSearch as a single-node cluster:
sudo -i # become Root

nano /etc/opensearch/opensearch.yml


# OpenSearch Configuration
cluster.name: soc-lab-cluster
node.name: SOC-OS-01

network.host: 0.0.0.0
http.port: 9200

discovery.type: single-node

path.data: /data/opensearch
path.logs: /var/log/opensearch

bootstrap.memory_lock: true
I configured memory locking:
sudo -i # become Root

nano /usr/lib/systemd/system/opensearch.service

# Memory Lock Setting
LimitMEMLOCK=infinity
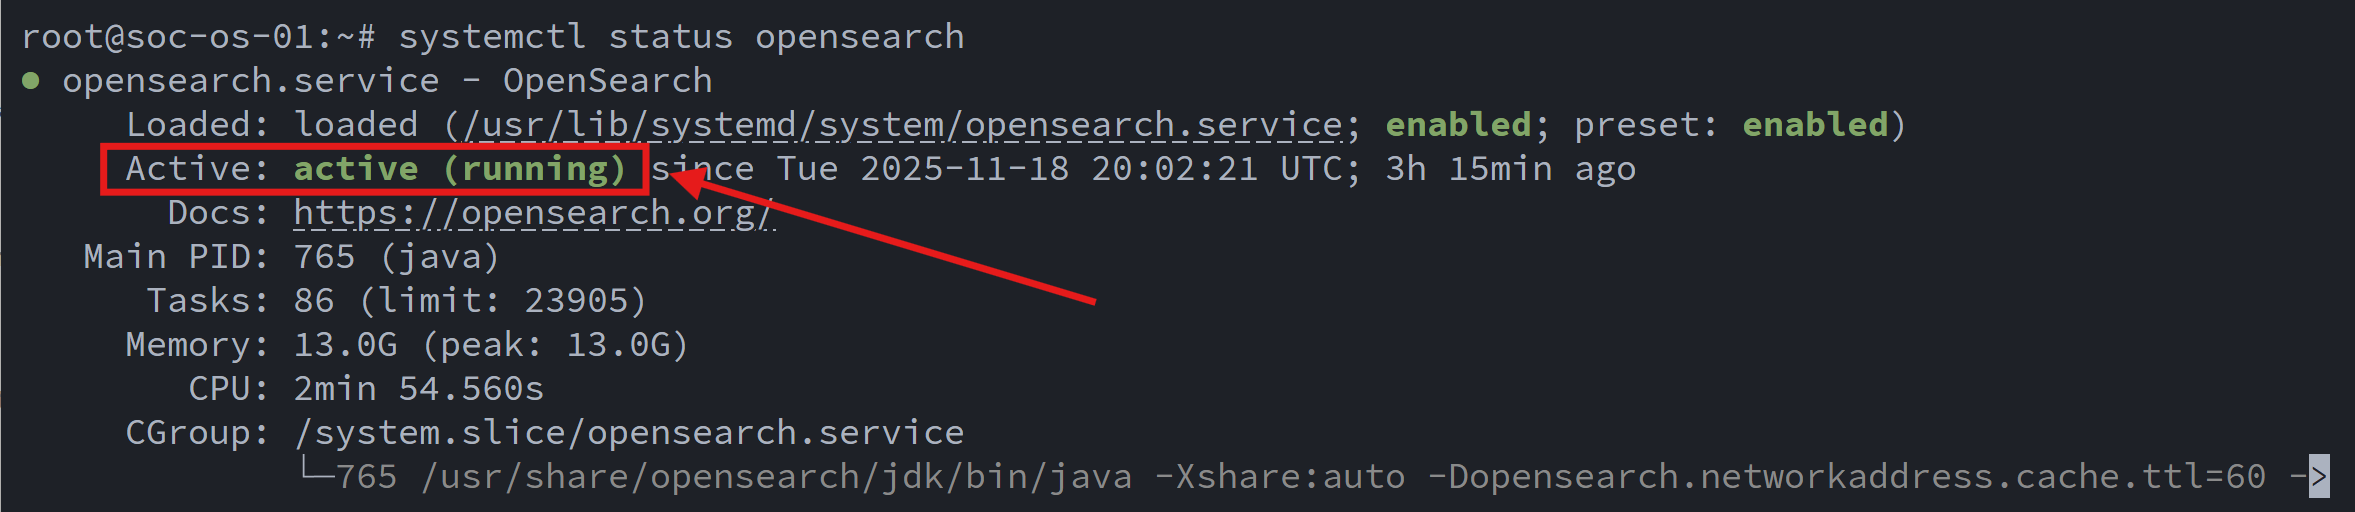
Finally, I enabled the service and verified it was running:
systemctl enable --now opensearch
systemctl status opensearch
Wazuh Manager & Dashboard Deployment
With the OpenSearch indexer in place, the next phase was to deploy Wazuh, the central SIEM platform for the Mini SOC. Wazuh is composed of two primary components that work together to collect, index, and visualize security events:
- Wazuh Manager: The core engine of the platform. It collects and analyzes security events from all enrolled agents, generates alerts, and forwards those alerts to the OpenSearch indexer through the built-in Filebeat service.
- Wazuh Dashboard: The web-based interface used by the SecOps team to explore alerts, run queries, investigate threats, and visualize activity across the environment. The dashboard reads data directly from OpenSearch and provides a unified analyst experience.
Standing up these components was more challenging than expected. Several compatibility and version alignment issues surfaced during deployment, requiring careful configuration and troubleshooting to ensure both Wazuh and OpenSearch communicated correctly and reliably.
- Create the VM
- Install the Operating System (Ubuntu Server)
- Install & configure Wazuh-Manager and link it to OpenSearch
- Install & configure Wazuh-Dashboard
VM Creation:
I created a new Proxmox VM with the following specifications:
- VM Name: VM-SOC-WAZ-01
- RAM: 8GB
- CPU: 1 Socket with 4 Cores
- BIOS: SeaBIOS (Default)
- Machine Type: q35
- Hard Drive: 80GB
- Network: vmbr1 (Tagged as VLAN 20)
Due to a Filebeat service incompatibility related to glibc on Ubuntu Server 24.04 LTS, I ultimately decided to start over and deploy Ubuntu Server 22.04 LTS, which remains under standard support until 2027.
After installing the latest OS updates, I added the Wazuh package repository and installed the Wazuh Manager:
# Add Wazuh GPG key
curl -s https://packages.wazuh.com/key/GPG-KEY-WAZUH \
  | gpg --no-default-keyring \
        --keyring gnupg-ring:/usr/share/keyrings/wazuh.gpg \
        --import && chmod 644 /usr/share/keyrings/wazuh.gpg

# Add Wazuh APT repo
echo "deb [signed-by=/usr/share/keyrings/wazuh.gpg] https://packages.wazuh.com/4.x/apt/ stable main" \
  | tee /etc/apt/sources.list.d/wazuh.list

apt-get update

apt-get install -y wazuh-manager
systemctl enable --now wazuh-manager
systemctl status wazuh-manager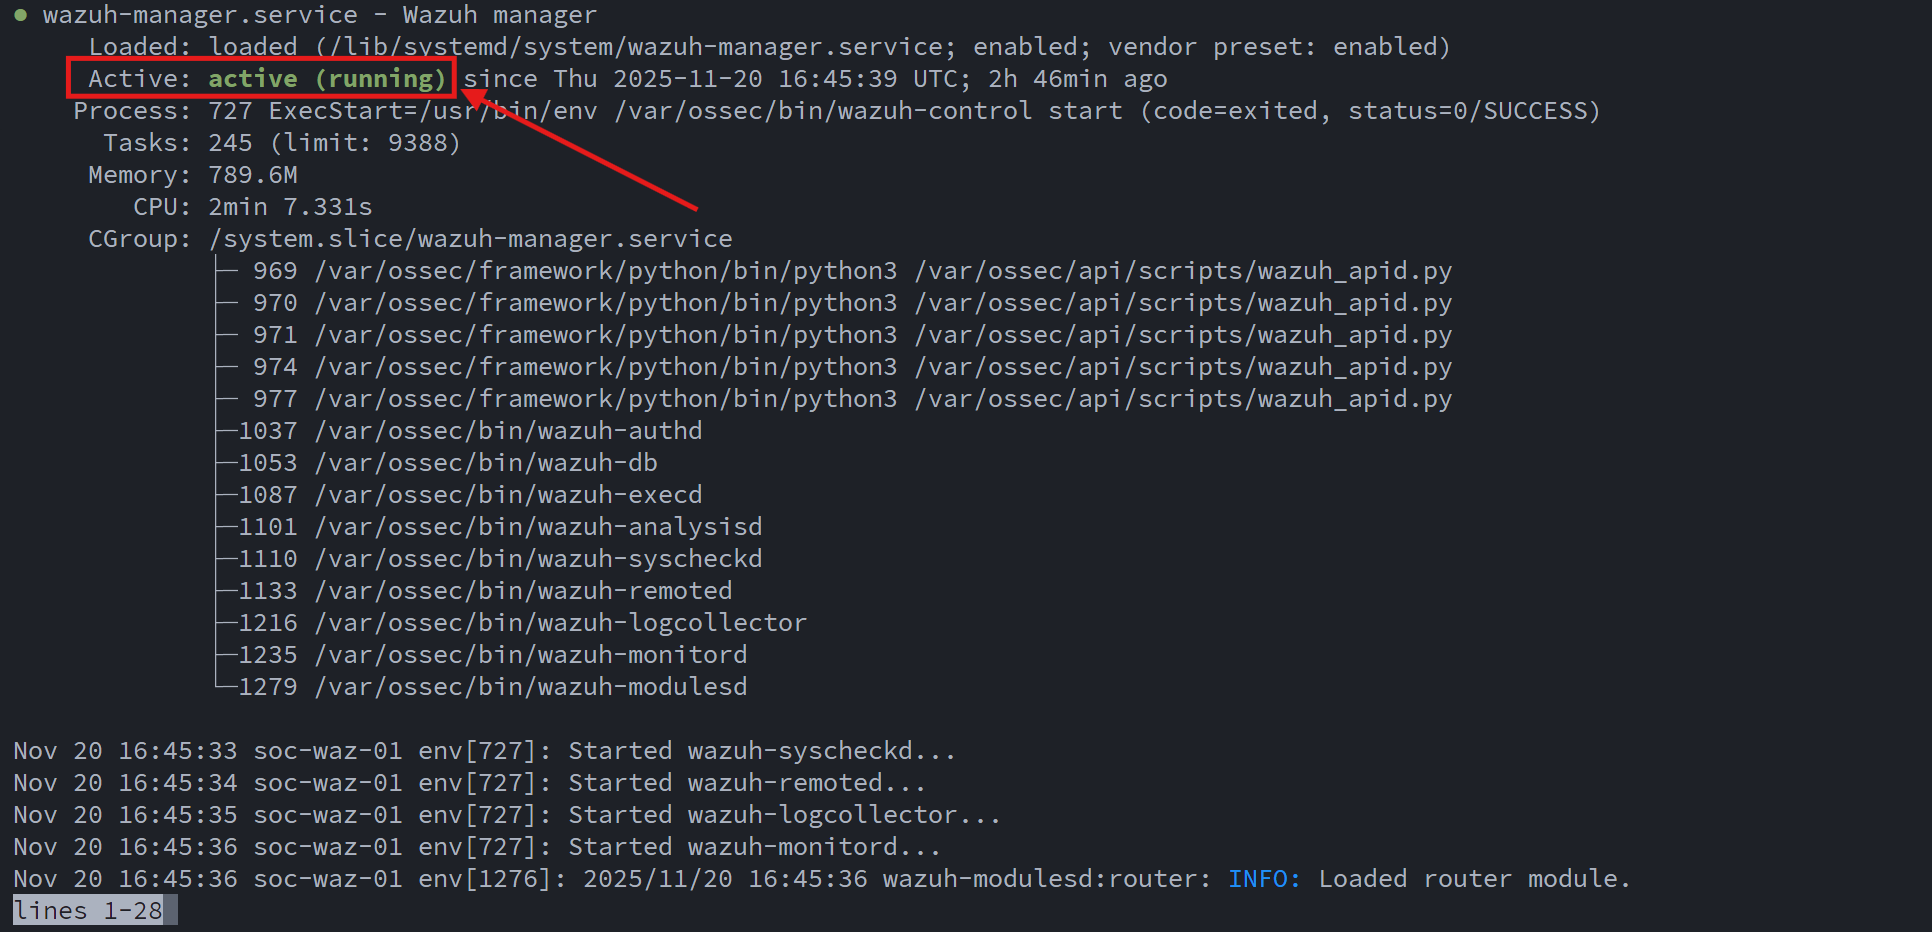
Next, I installed the Filebeat service and downloaded the "starter" configuration template from the Wazuh repository:
apt-get install -y filebeat

# get filebeat config template
curl -so /etc/filebeat/filebeat.yml \
  https://packages.wazuh.com/4.14/tpl/wazuh/filebeat/filebeat.yml
Configuring Filebeat turned out to be one of the more challenging parts of the deployment. After a great deal of research and trial-and-error, I arrived at a configuration that works reliably with my OpenSearch backend:
#########################
# Filebeat – Wazuh → OpenSearch
#########################

seccomp.enabled: false

filebeat.inputs:
  - type: log
    enabled: true
    paths:
      - /var/ossec/logs/alerts/alerts.json
    json.keys_under_root: true
    json.add_error_key: true
    json.overwrite_keys: true
    close_older: 1h
    scan_frequency: 10s

setup.template.enabled: false
setup.ilm.enabled: false

output.elasticsearch:
  hosts: ["https://10.0.20.180:9200"]
  protocol: "https"
  username: "*******"
  password: "***************"

  # CRITICAL: Disable legacy document types for OpenSearch 2.x
  use_type: false

  index: "wazuh-alerts-%{+yyyy.MM.dd}"

  ssl.verification_mode: "none"

logging.level: info
logging.to_files: true
logging.files:
  path: /var/log/filebeat
  name: filebeat
  keepfiles: 7
  rotateeverybytes: 10485760
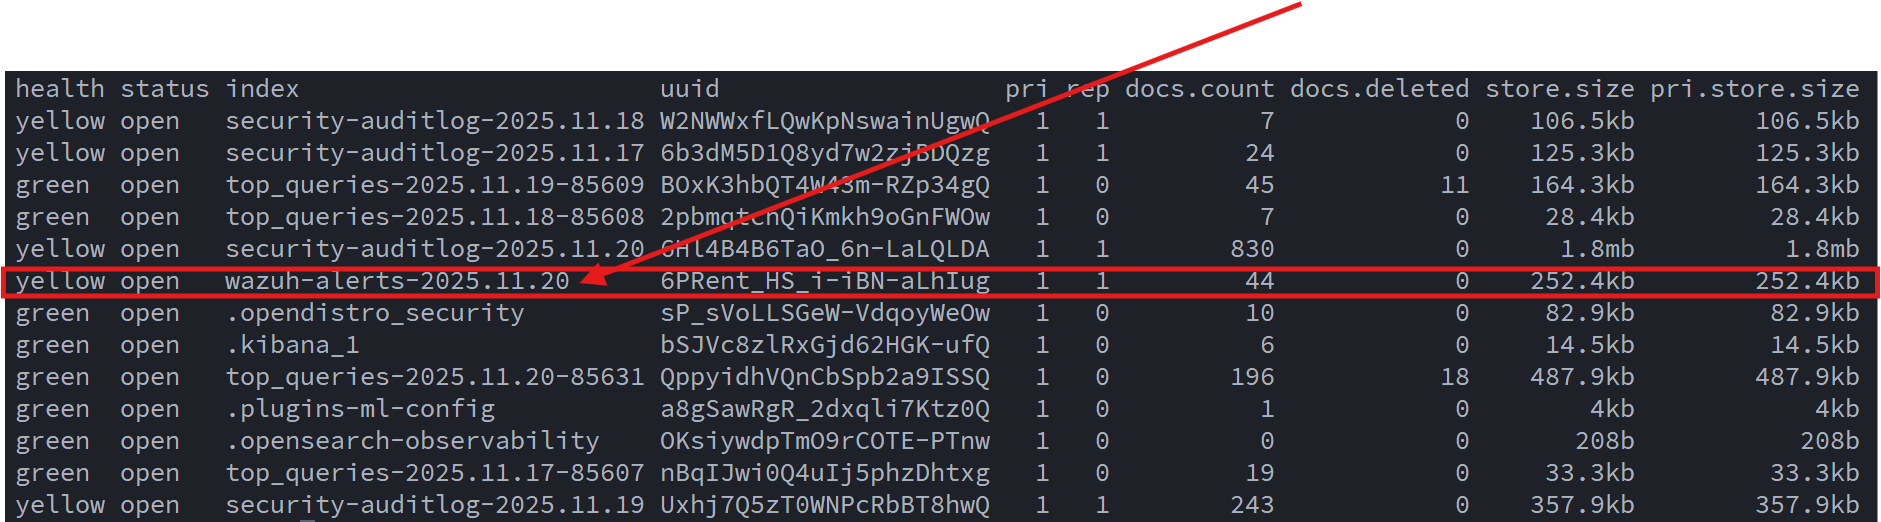
With this configuration in place, Wazuh alerts were successfully flowing into OpenSearch:
With indexing now working, I installed the Wazuh Dashboard:
apt-get update

apt-get install -y wazuh-dashboard
systemctl enable --now wazuh-dashboard
Initially, the Dashboard was unable to retrieve alert data from the OpenSearch API. After additional troubleshooting, I discovered that OpenSearch needed a manual mapping update to properly interpret the Wazuh alert structure, specifically for the manager.name field. This required a custom PUT request:
curl -k -u ****:******** \
  -X PUT "https://10.0.20.180:9200/wazuh-alerts-*/_mapping" \
  -H 'Content-Type: application/json' \
  -d '{
    "properties": {
      "manager": {
        "properties": {
          "name": {
            "type": "text",
            "fielddata": true
          }
        }
      }
    }
  }'
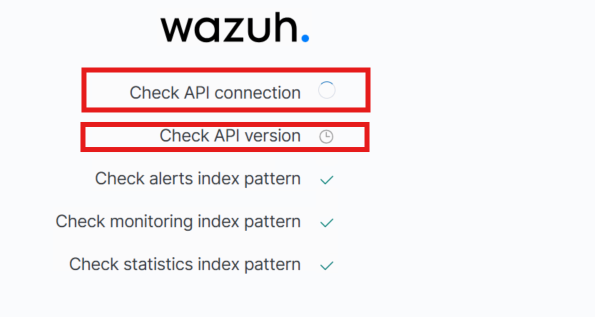
After applying this mapping update, the Wazuh Dashboard was finally able to load and communicate with the OpenSearch API without issues:
At this stage, the initial deployment of the Wazuh Manager and Wazuh Dashboard is complete. The follow-up steps will be to:
- Add an SSL certificate from the internal Certificate Authority
- Begin deploying agents to the lab environment
At this point the Mini SOC stack was officially coming together!
Suricata Intrusion Detection System (IDS) Deployment
After getting Wazuh up and running, the next step was deploying Suricata and forwarding its alerts to OpenSearch so they could be visualized within the Wazuh Dashboard. Much like the Wazuh deployment, integrating Suricata with OpenSearch required more work than expected. Proper ingestion and visibility in the alert pipeline required several manual customizations, adjusting mappings, index settings, and data formatting to ensure Suricata events were parsed correctly and displayed within Wazuh.
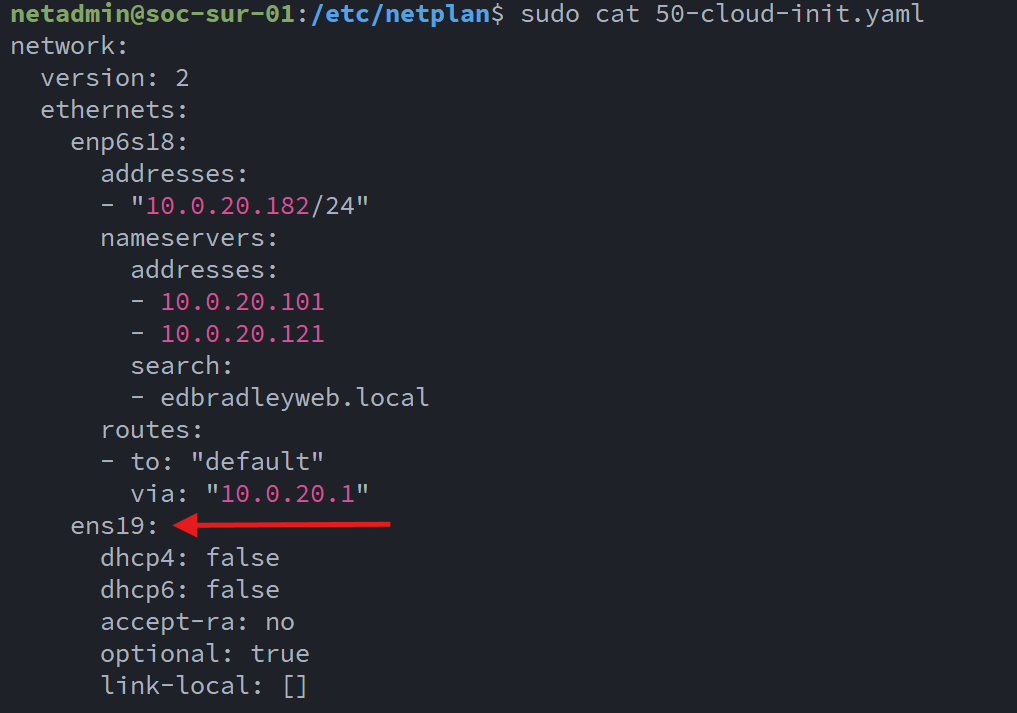
I created an Ubuntu 24.04 LTS VM in Proxmox to host the IDS:
The VM includes an additional virtual NIC (net1) that is connected to the dedicated SPAN (mirror) port on the core switch. Suricata uses this interface to ingest and inspect mirrored network traffic in real time. It analyzes packets, generates alerts, and forwards those alerts to OpenSearch, where they become visible in the Wazuh Dashboard.
After installing the latest OS updates, I added the Suricata package repository and installed the IDS:
sudo apt-get update
sudo apt-get install software-properties-common -y
sudo add-apt-repository ppa:oisf/suricata-stable -y
sudo apt-get update
sudo apt-get install suricata suricata-update -y
I then configured the designated SPAN port on the core switch. All trunk/uplink ports are set to mirror their traffic to Port 13, which is connected to the SPAN NIC on the Proxmox server. This mirrored interface is shared by the SOC VMs, allowing them to inspect live network traffic:
sw-core-01# configure terminal

! FortiGate trunk
sw-core-01(config)# monitor session 1 source interface tengigabitethernet1/0/2 both

! Meraki trunk
sw-core-01(config)# monitor session 1 source interface tengigabitethernet1/0/3 both

! Access port for test PC on VLAN 30
sw-core-01(config)# monitor session 1 source interface tengigabitethernet1/0/7 both

! Edge switch trunks
sw-core-01(config)# monitor session 1 source interface tengigabitethernet1/0/12 both
sw-core-01(config)# monitor session 1 source interface tengigabitethernet1/0/24 both

sw-core-01(config)# end
sw-core-01# write memory
I configured the SPAN Port to be completely passive:
After some research and trial-and-error, I was able to build a working configuration for the sensor/SPAN connection:
af-packet:
  - interface: enp6s19
    threads: auto
    cluster-id: 99
    cluster-type: cluster_flow
    defrag: yes
    use-mmap: yes
    tpacket-v3: yes
    ring-size: 200000
    buffer-size: 524288
    disable-promisc: no
    checksum-checks: auto
    copy-mode: none
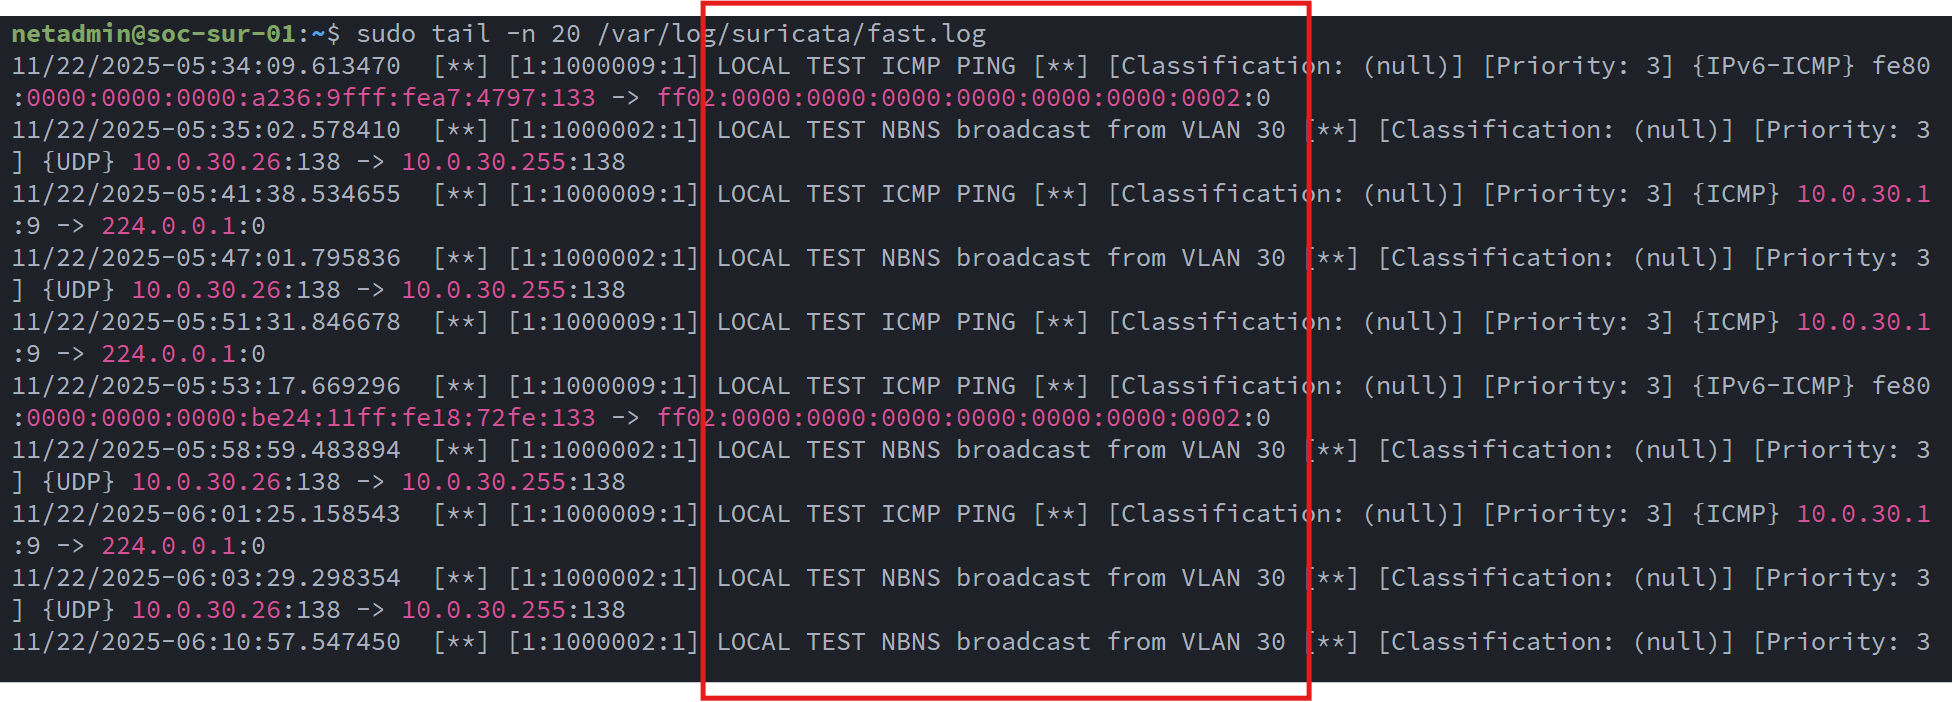
I set up some test rules to trigger some IDS allerts. I verified them in the log file:
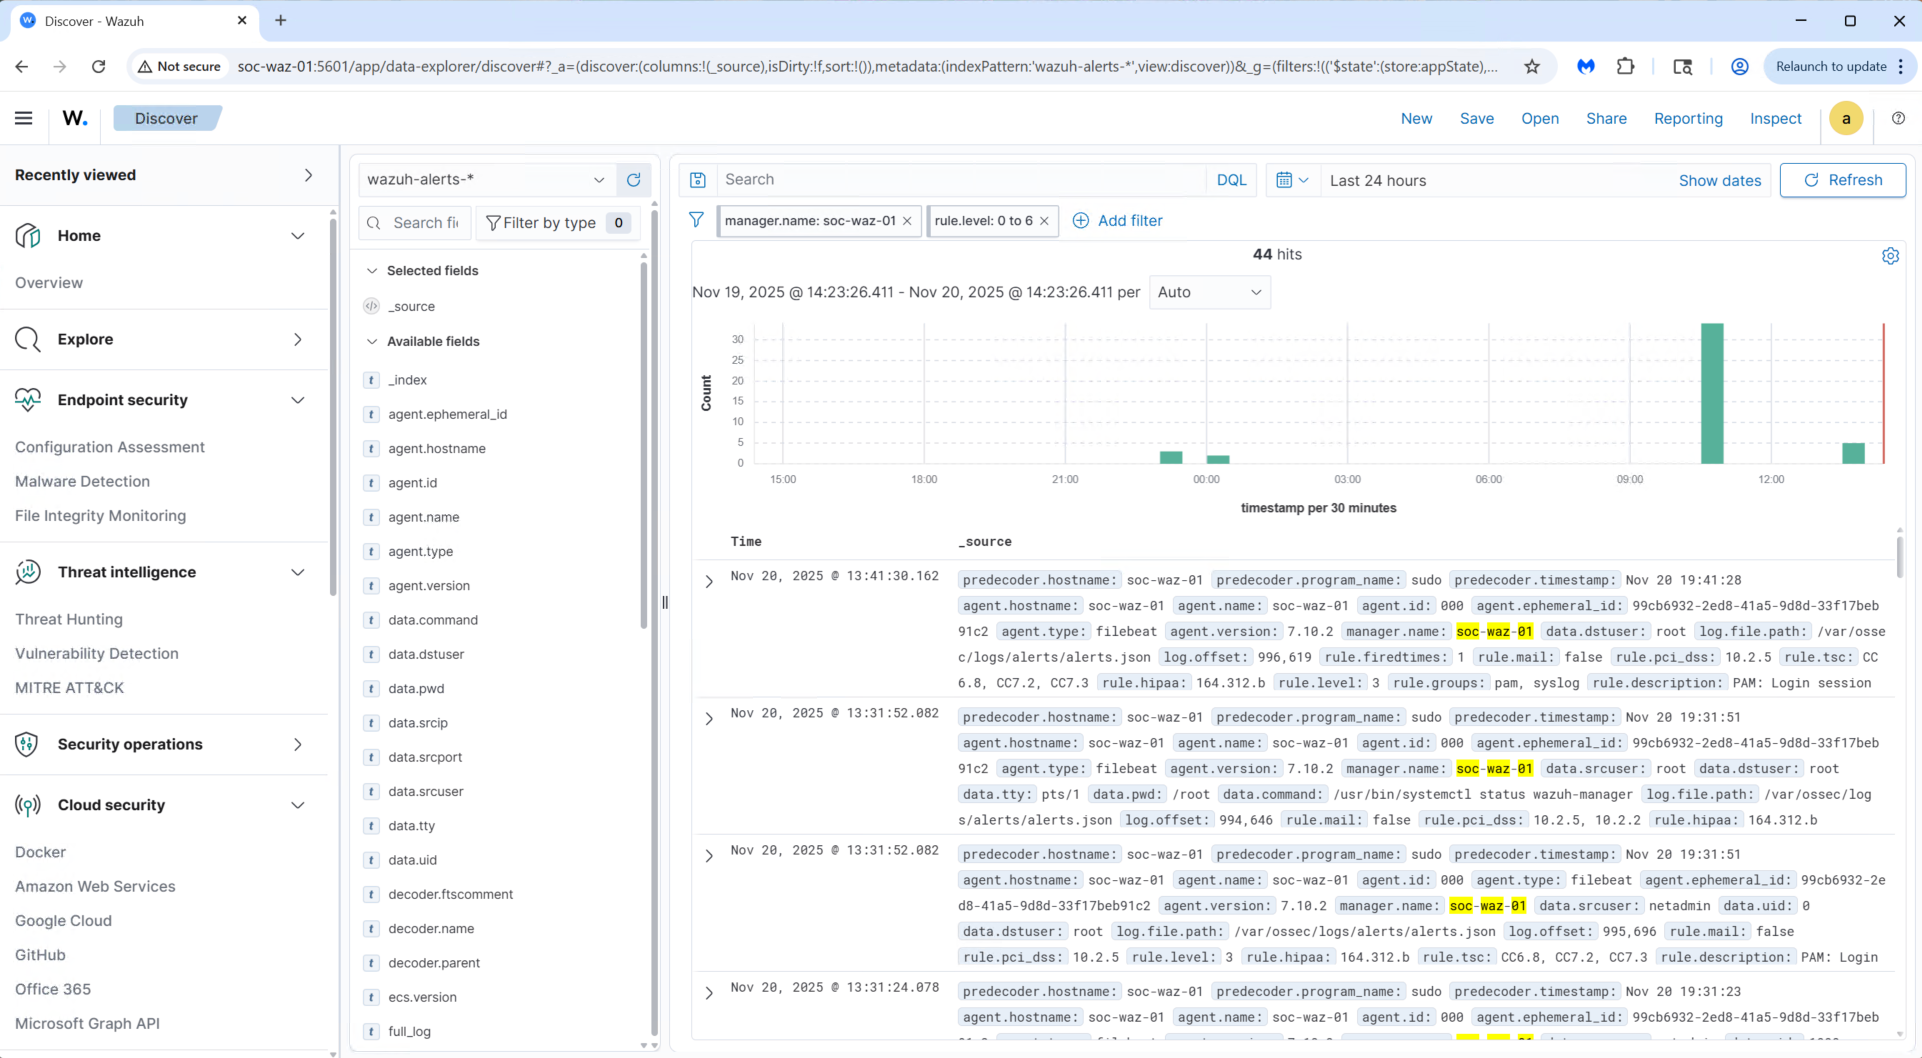
With Suricata generating alerts, the next step was to forward the IDS log data to Wazuh. Using the Wazuh Dashboard, I generated the enrollment command for the Suricata VM (soc-sur-01) and installed the agent:
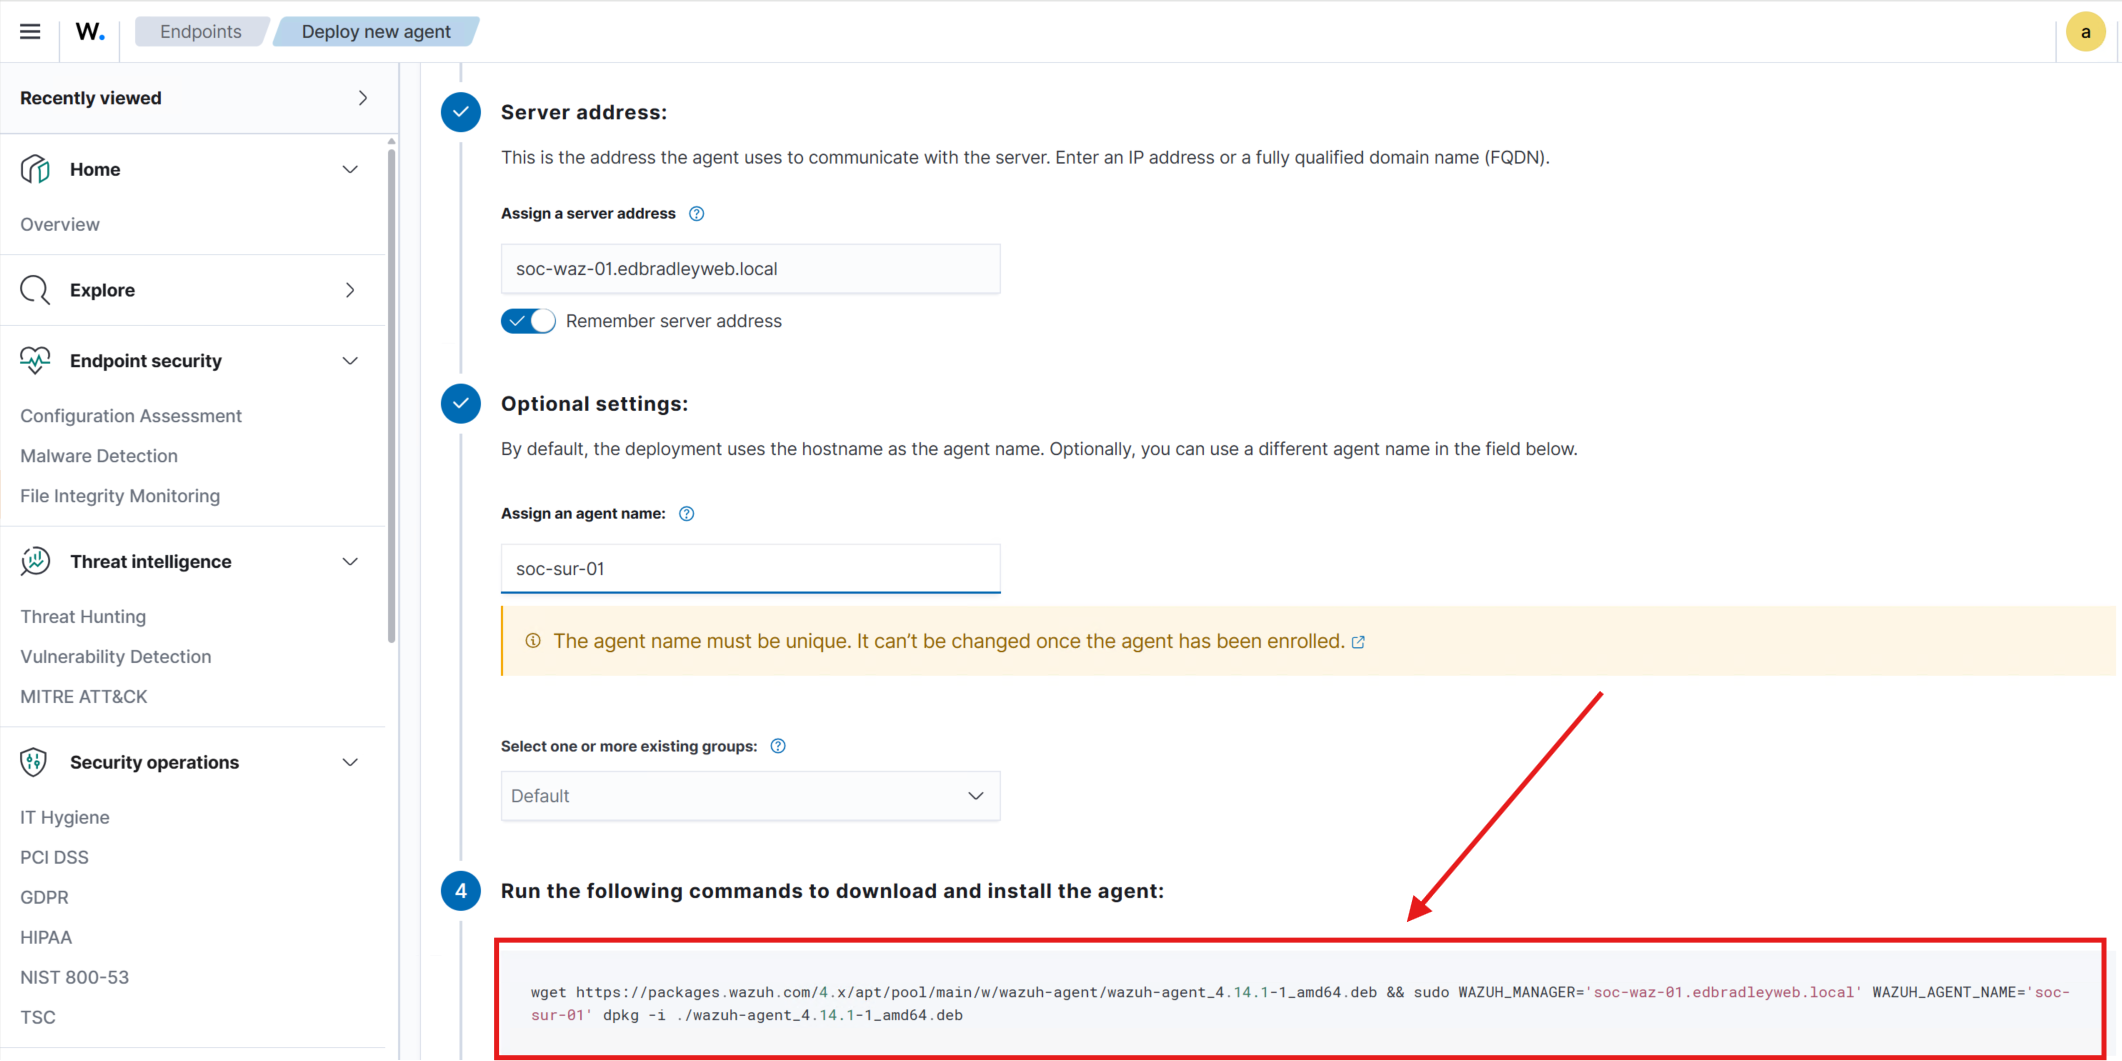
I ran the command to download the agent and point it at my Wazuh Dashboard. I configured the agent to pull the IDS log/alert JSON data:
sudo nano /var/ossec/etc/ossec.conf
  <localfile>
    <log_format>json</log_format>
    <location>/var/log/suricata/eve.json</location>
  </localfile>
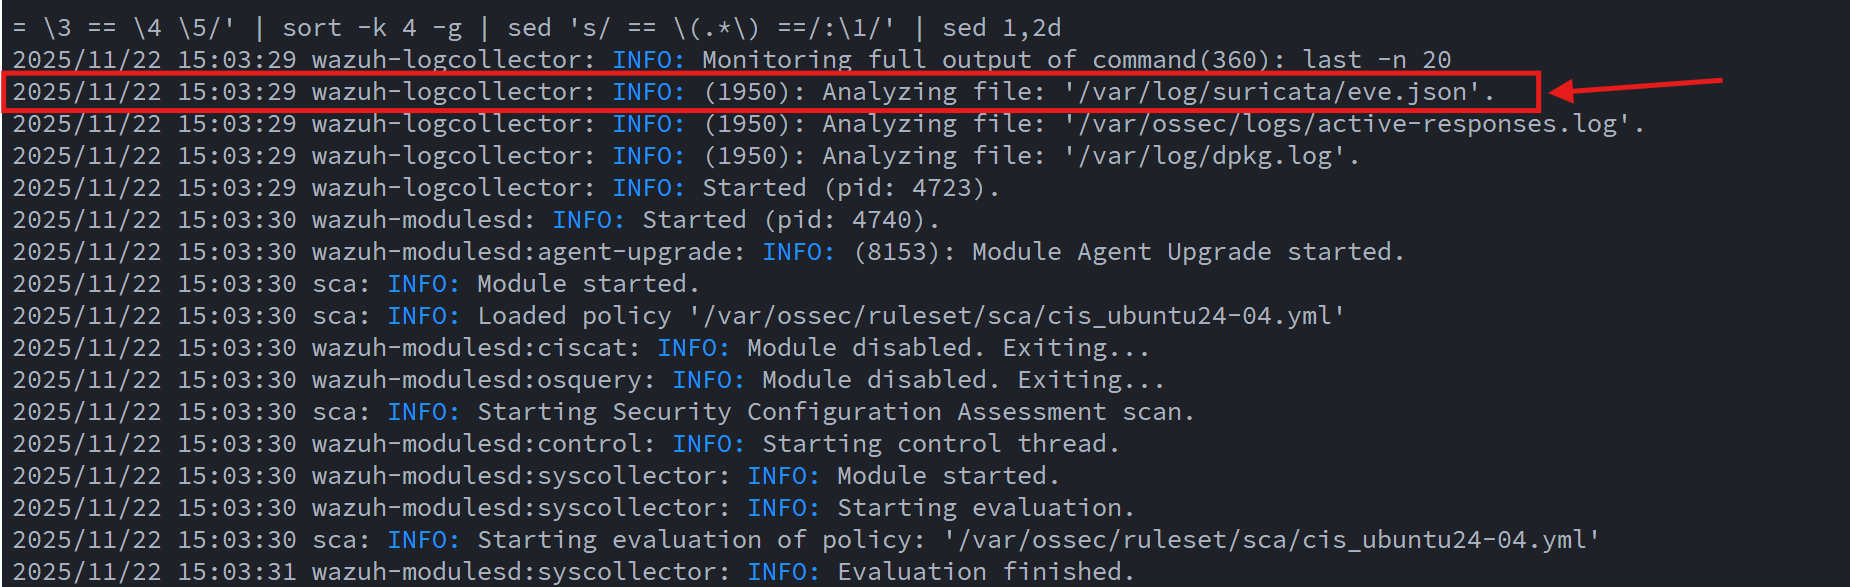
I verified, in the log, that the Suricata data was being ingested by the Wazuh agent:
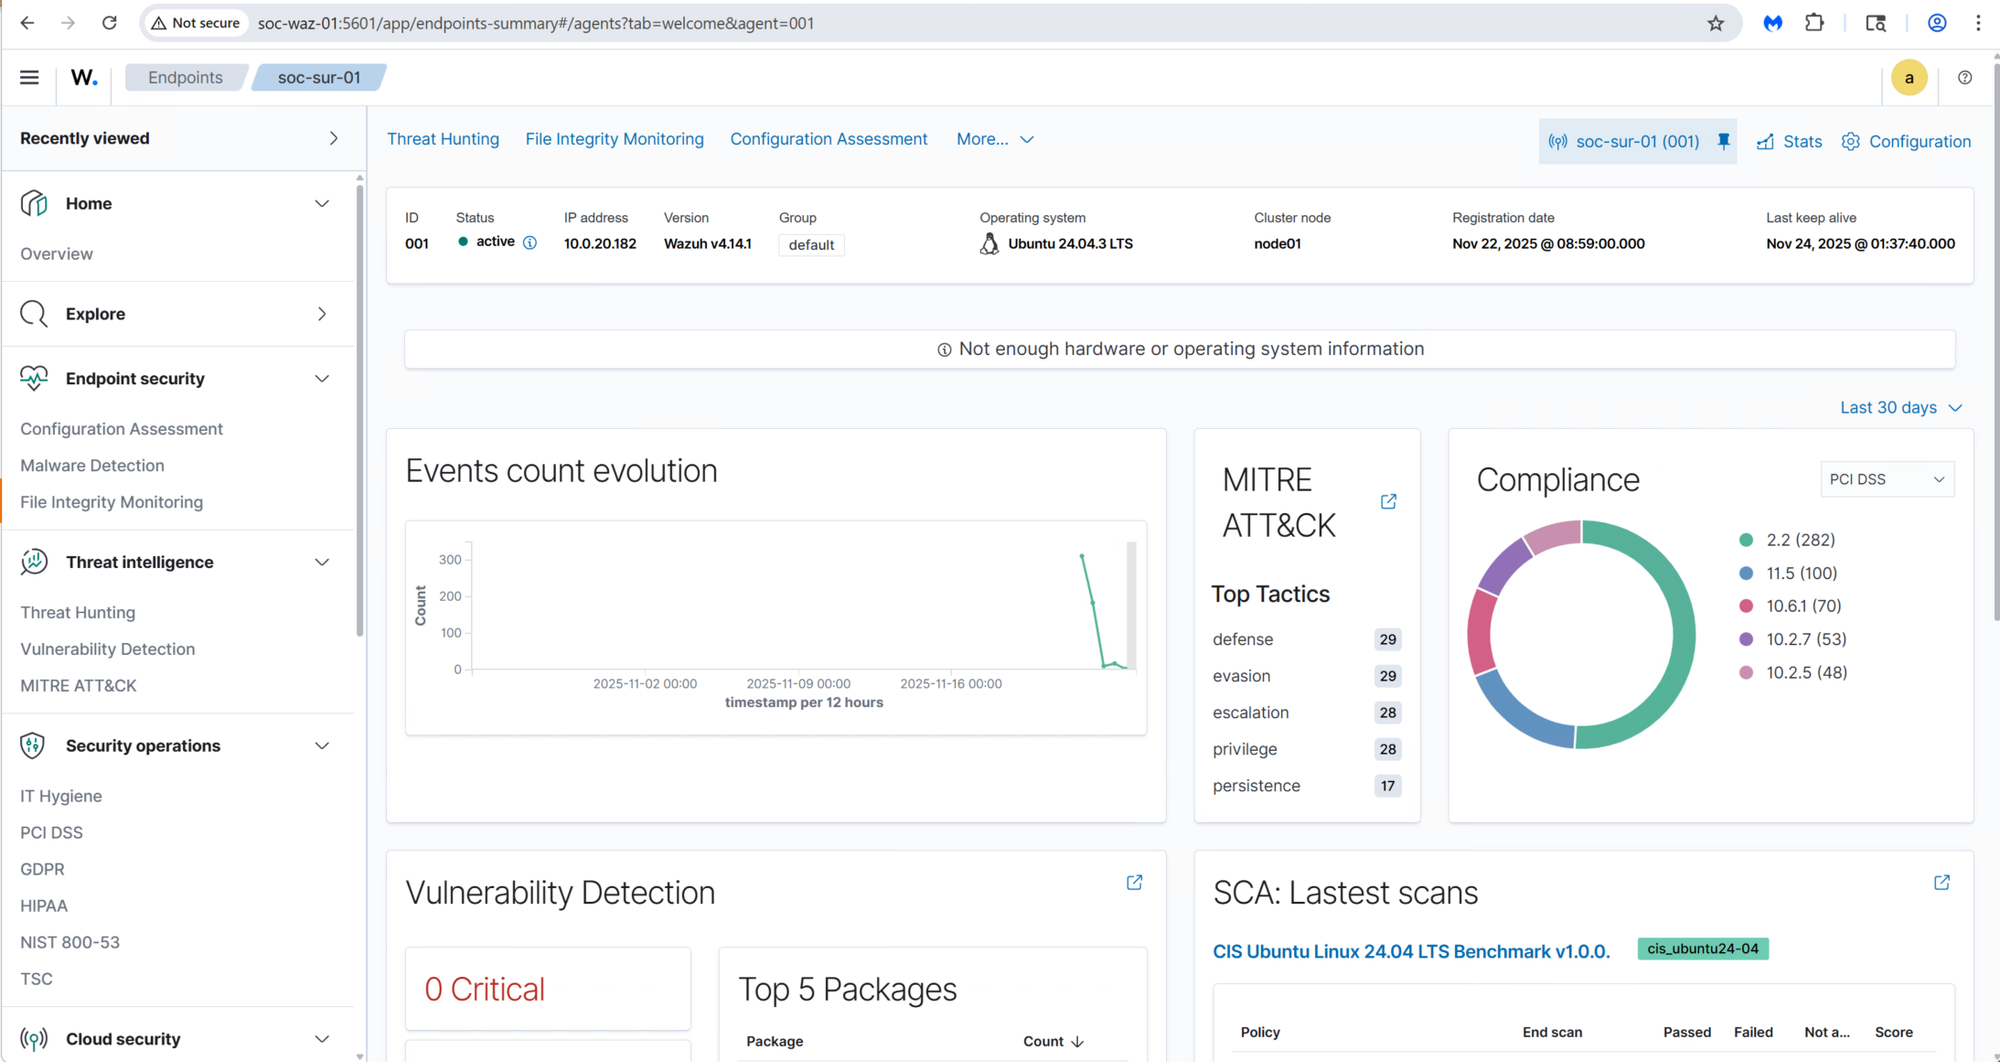
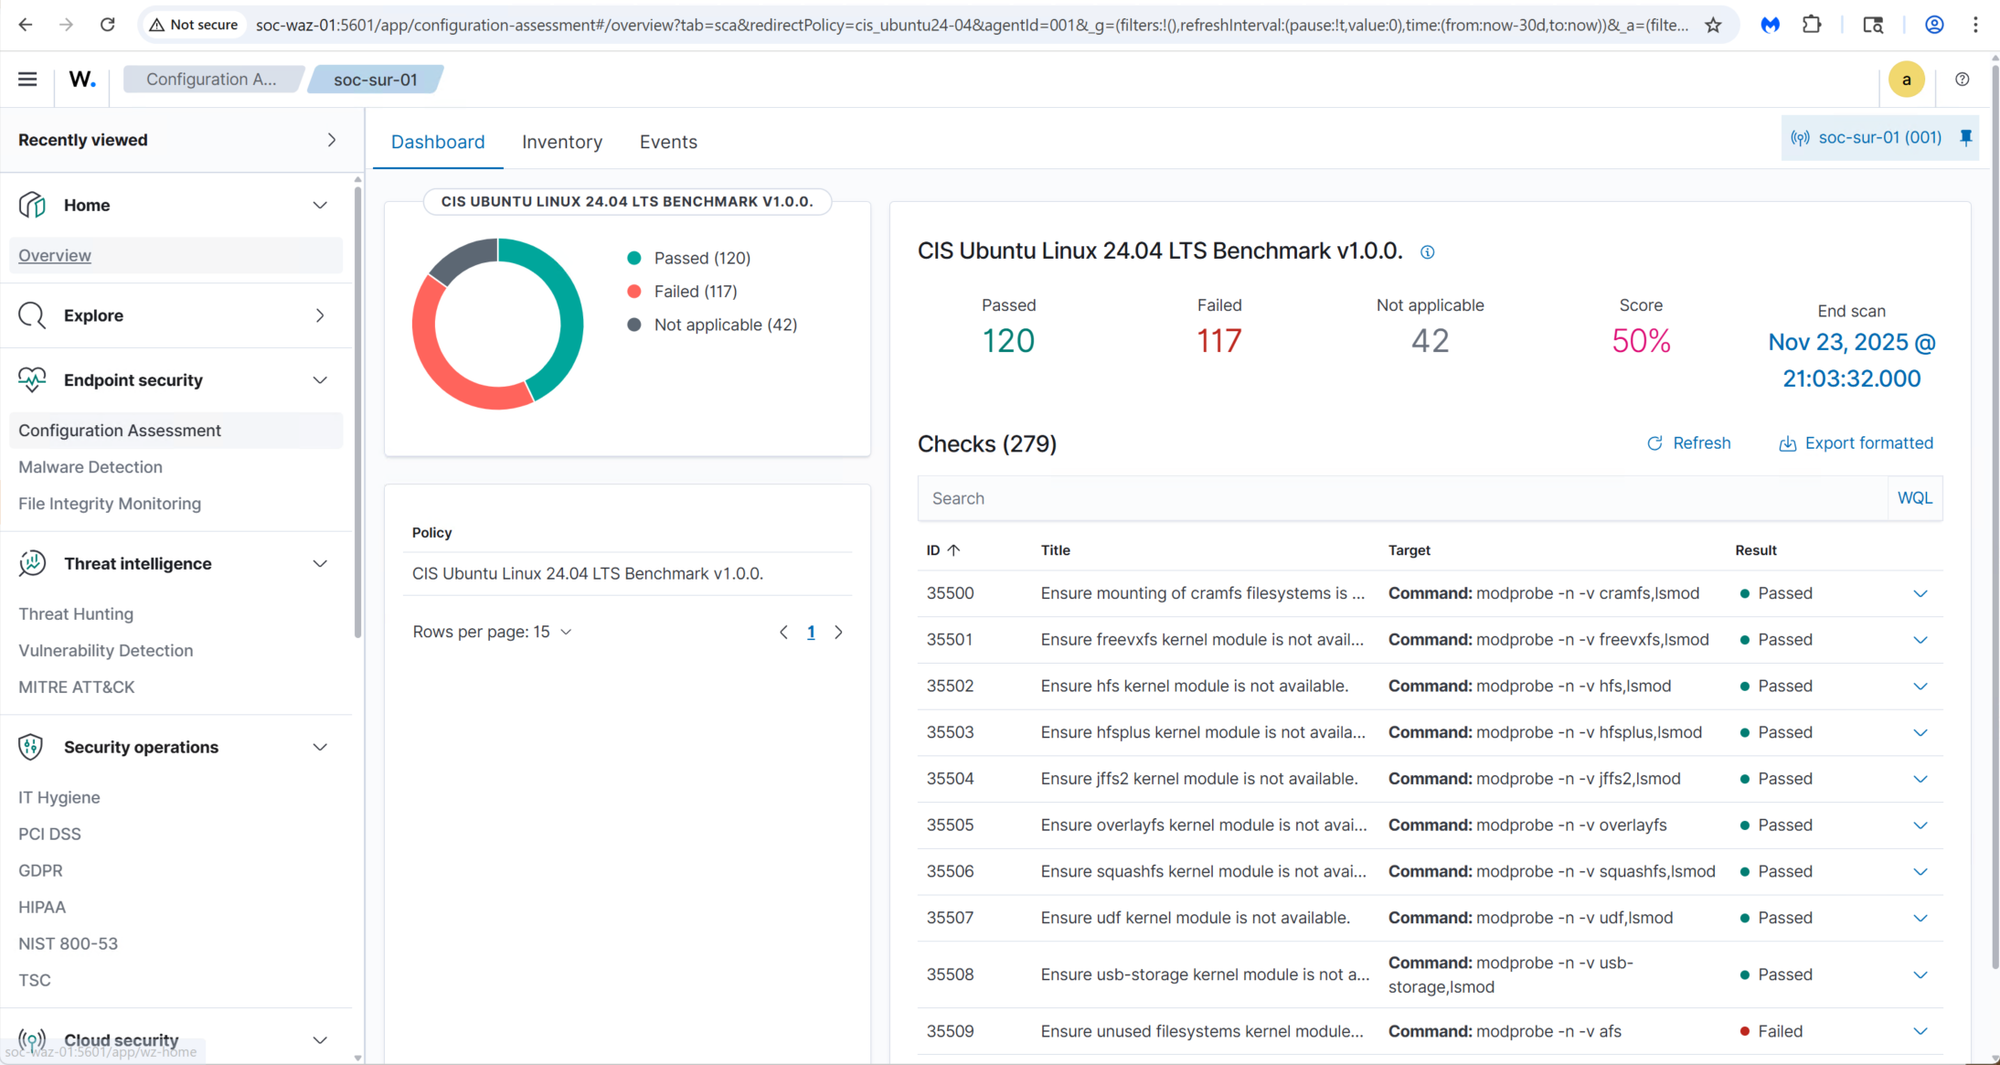
Once the agent was active, Wazuh also began evaluating the VM for vulnerabilities and compliance baselines, providing capabilities similar to commercial SIEM/EDR platforms:
Initially, the Wazuh Dashboard generated errors when attempting to load some visualizations. These issues were caused by missing field mappings within the Wazuh alert indices in OpenSearch:
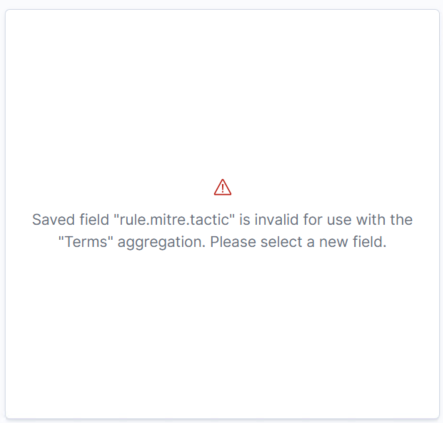
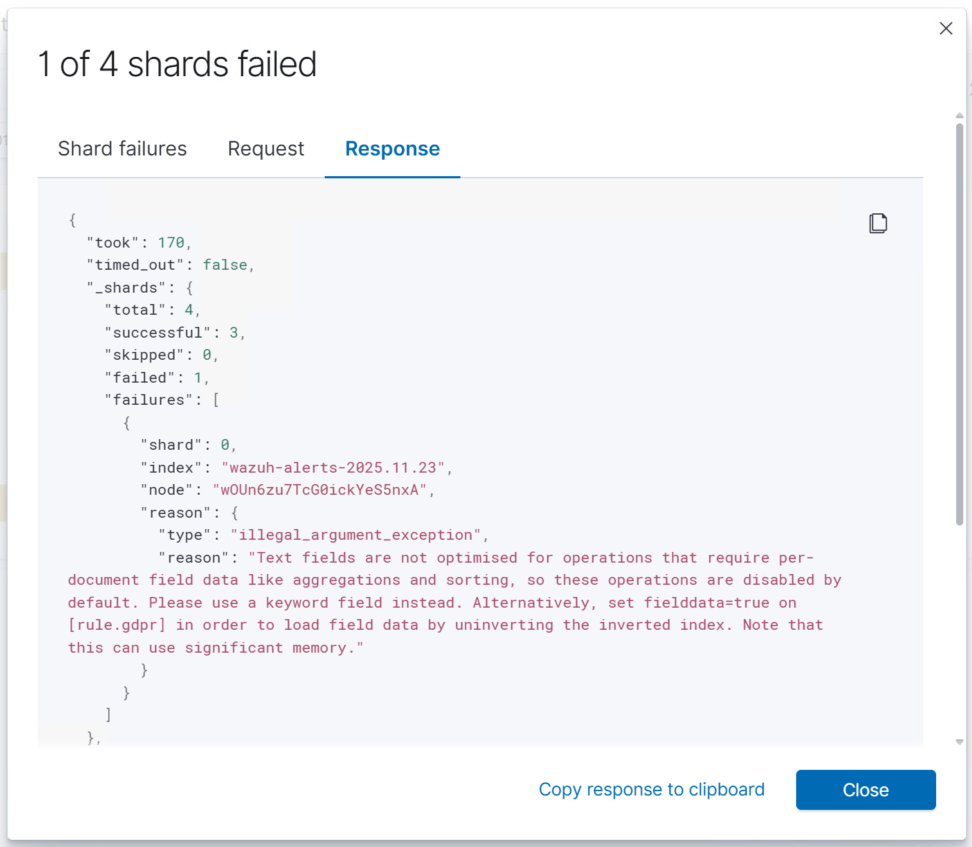
I researched this and found that I had to use the OpenSearch API to tweak some the field mapping and query attributes in order to properly fetch the data:
cat << 'EOF' > /tmp/wazuh_pci_template.json
{
  "index_patterns": [ "wazuh-alerts-*" ],
  "priority": 500,
  "template": {
    "mappings": {
      "properties": {
        "rule": {
          "properties": {
            "pci_dss": {
              "type": "text",
              "fielddata": true
            }
          }
        }
      }
    }
  }
}
EOF
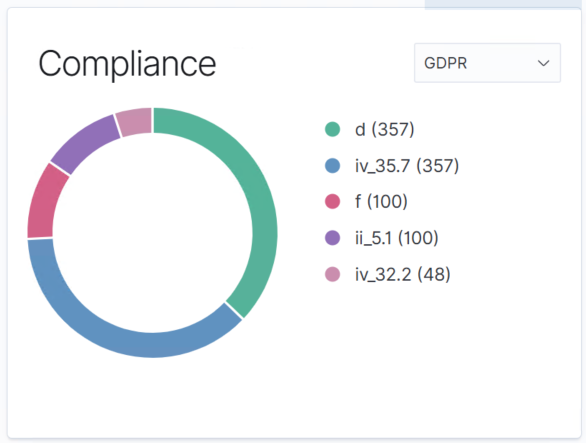
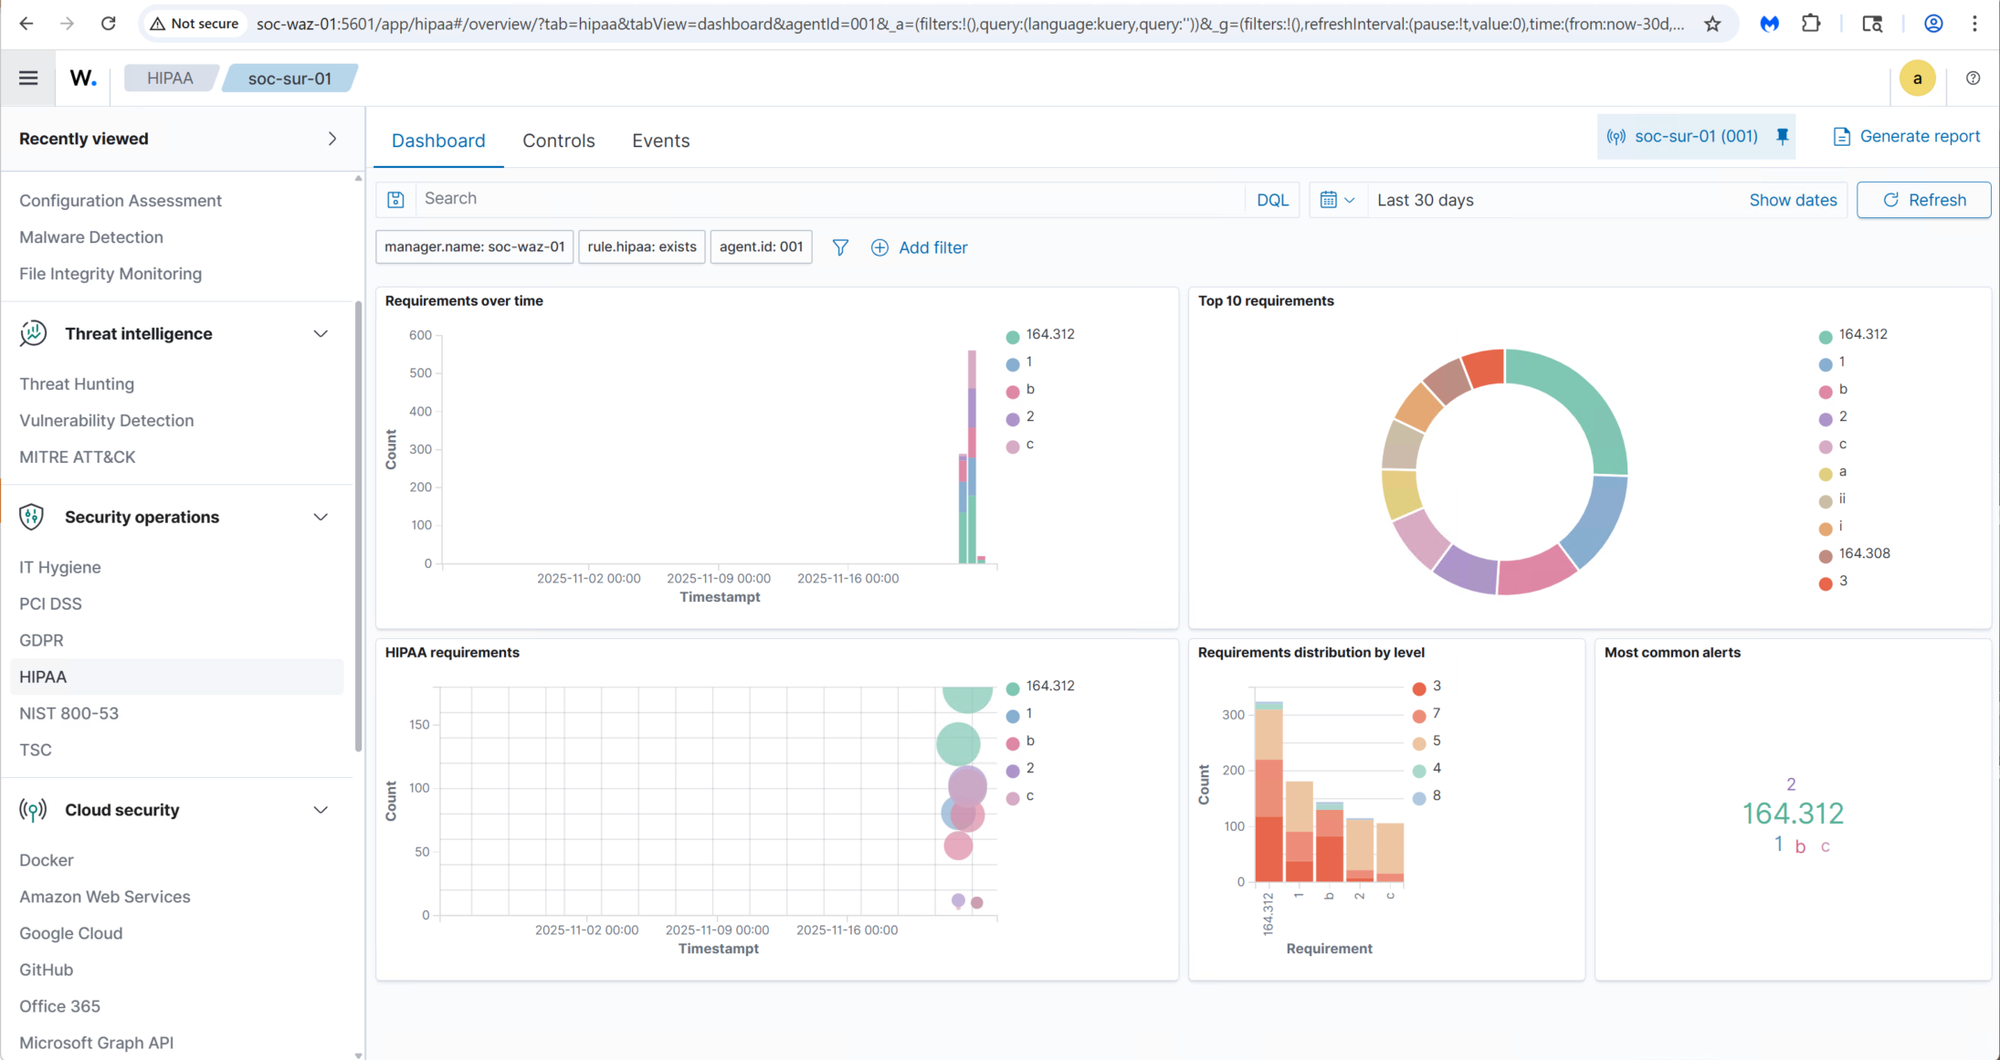
Once properly configured, Wazuh provides a comprehensive SIEM with Security Standard compliance, Vulnerability management, and tracking support. It closely mimics the Paid Enterprise Solutions:
Not only does Wazuh identify vulnverablities but it provides a detailed remediation for each issue:
A Complete SIEM Experience
Once properly configured, Wazuh delivers a comprehensive SIEM solution, with compliance checks, vulnerability management, alert correlation, and detailed remediation guidance. The result is a highly capable platform that closely mirrors many features found in paid enterprise security solutions.
In the coming weeks, I will continue exploring Wazuh’s advanced capabilities and begin deploying agents to additional endpoints across the network.
Zeek – Network Protocol & Behavioral Analysis System Deployment
With the IDS layer in place, the next step was deploying Zeek to complement Suricata by providing rich, protocol-level network activity data. I created a dedicated VM in Proxmox to host the Zeek sensor:
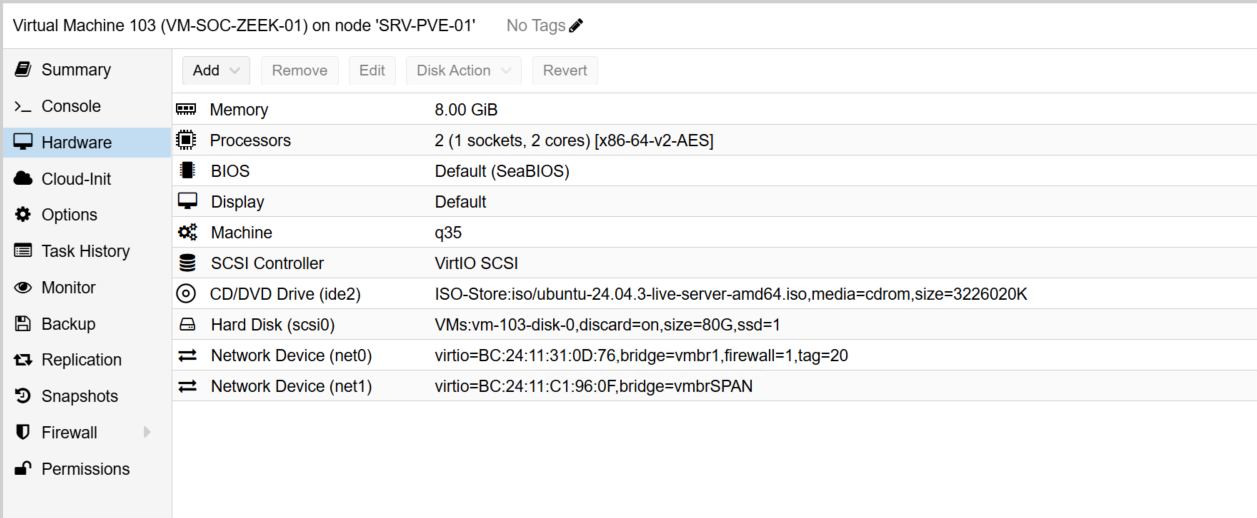
Like Suricata, the Zeek VM includes an additional virtual NIC that is connected to the switch’s SPAN (mirror) port, allowing it to ingest mirrored network traffic for deep inspection.
After installing Ubuntu updates, I added the Zeek repository and installed the platform:
echo "deb http://download.opensuse.org/repositories/security:/zeek/xUbuntu_24.04/ /" | \
  sudo tee /etc/apt/sources.list.d/security:zeek.list

curl -fsSL https://download.opensuse.org/repositories/security:/zeek/xUbuntu_24.04/Release.key \
  | gpg --dearmor | sudo tee /etc/apt/trusted.gpg.d/security_zeek.gpg > /dev/null

sudo apt update
sudo apt install -y zeek
I configured Zeek to operate in standalone mode and use the SPAN NIC for packet capture:
[zeek]
type=standalone
host=localhost
interface=enp6s19    # <--- SPAN NIC here
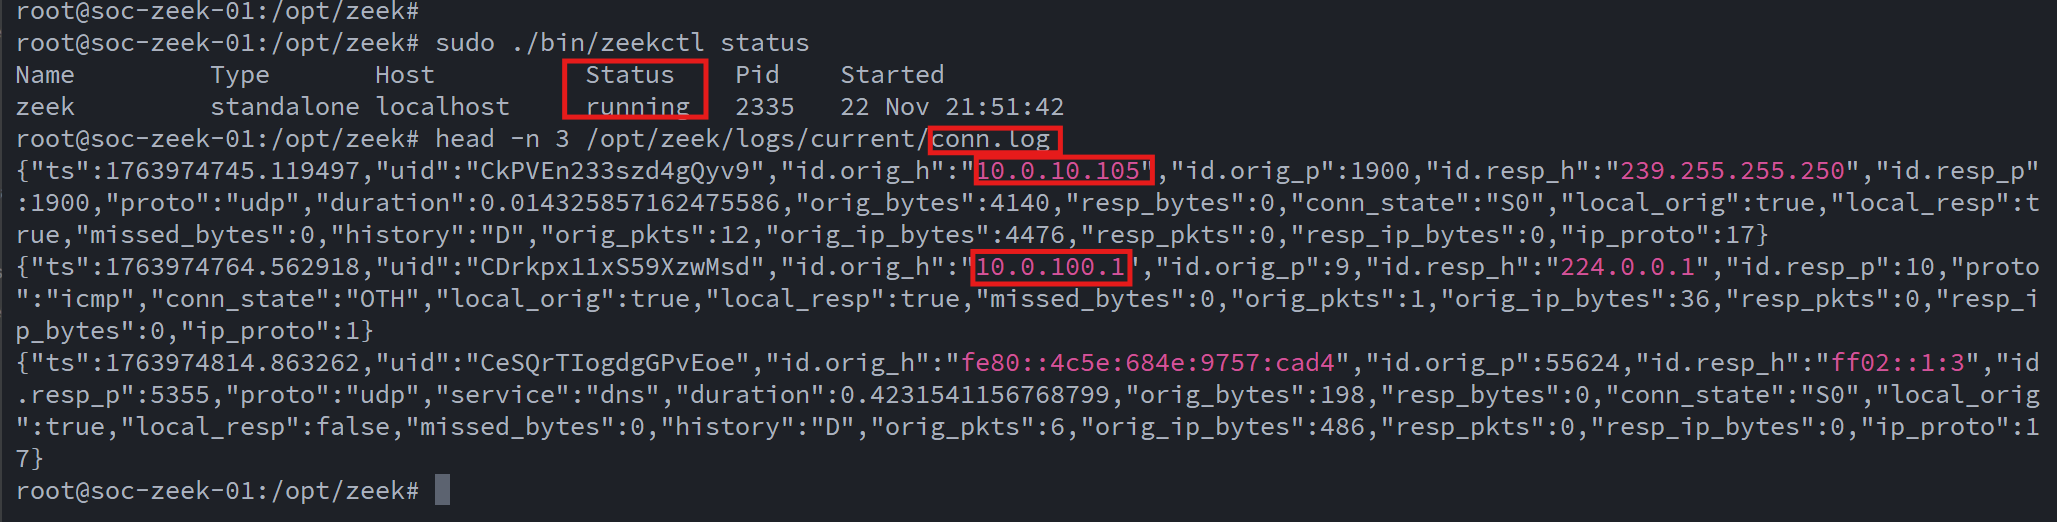
then deployed and started the Zeek service:
cd /opt/zeek
sudo ./bin/zeekctl deploy
sudo ./bin/zeekctl status
Once deployed, I verified that the service was running and generating log files under /opt/zeek/logs/current/.:
To integrate Zeek into the SIEM workflow, I installed the Wazuh agent and configured it to ingest Zeek’s structured JSON logs:
  <!-- Zeek conn log -->
  <localfile>
    <log_format>json</log_format>
    <location>/opt/zeek/logs/current/conn.log</location>
  </localfile>

  <!-- Zeek DNS log -->
  <localfile>
    <log_format>json</log_format>
    <location>/opt/zeek/logs/current/dns.log</location>
  </localfile>

  <!-- Optional extras -->
  <!--
  <localfile>
    <log_format>json</log_format>
    <location>/opt/zeek/logs/current/http.log</location>
  </localfile>

  <localfile>
    <log_format>json</log_format>
    <location>/opt/zeek/logs/current/ssl.log</location>
  </localfile>

  <localfile>
    <log_format>json</log_format>
    <location>/opt/zeek/logs/current/notice.log</location>
  </localfile>
  -->
This configuration ensures that Zeek activity logs appear alongside Suricata alerts and host-based security telemetry within the Wazuh Dashboard, providing a unified and correlated view of network and endpoint behaviors across the lab environment.
With the foundational data pipeline in place, I will spend the coming weeks fine-tuning the configuration and learning how to fully leverage Zeek’s capabilities within a SOC environment, such as protocol anomaly detection, threat hunting, and behavioral network analysis.
Deploying Grafana & Prometheus
To monitor the health and status of the SOC stack, I deployed Prometheus, installing the Prometheus Node Exporter on each server to collect system metrics, performance data, and basic host-level insights. Prometheus periodically scrapes these exporters and stores the metrics, which are then visualized and analyzed through Grafana Dashboards.
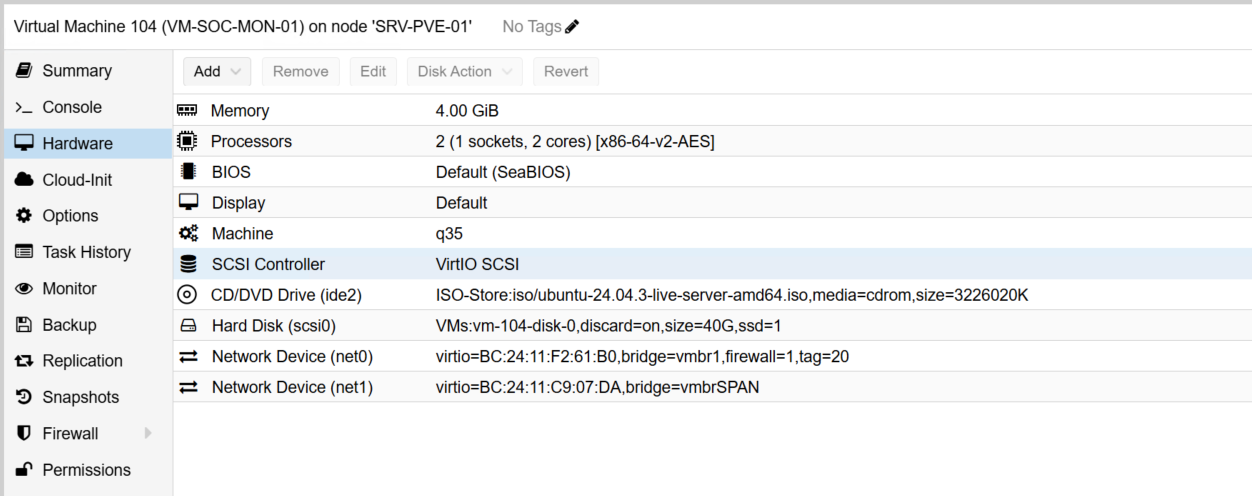
I provisioned a dedicated VM (soc-mon-01) to serve as the central monitoring node:
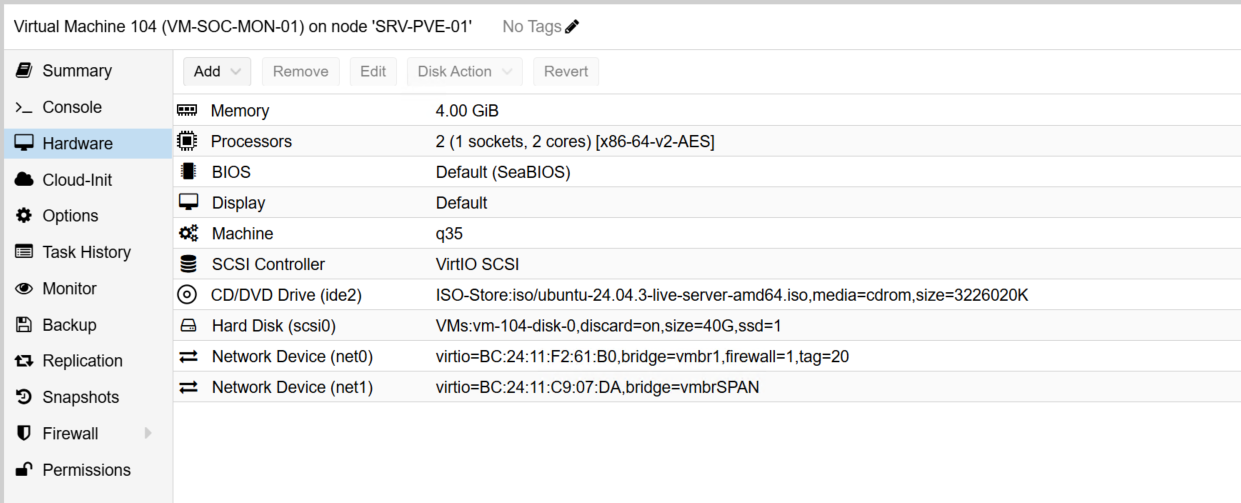
In addition to hosting Prometheus and Grafana, this VM also runs ntopng, a powerful traffic-analysis and flow-collection tool. To support ntopng, I added a secondary NIC connected to mirrored SPAN traffic from the core switch, allowing it to analyze live packet flows across the network.
I began by installing the Node Exporter on every server participating in the SOC stack:
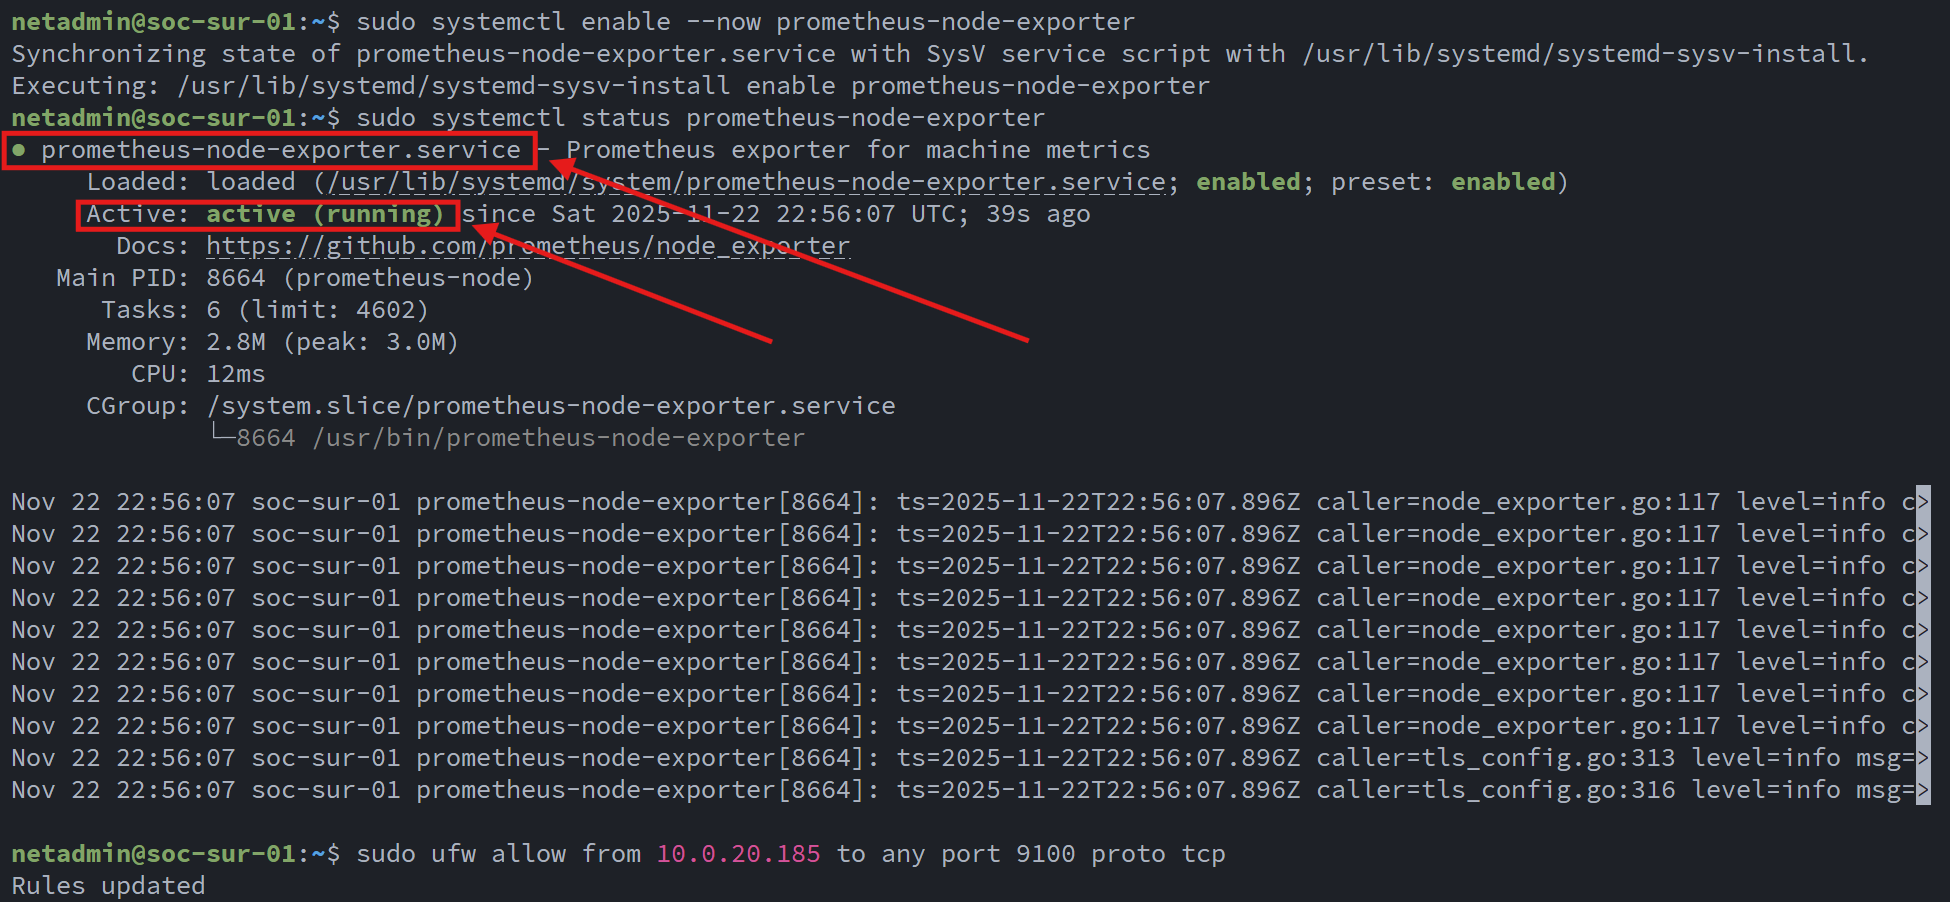
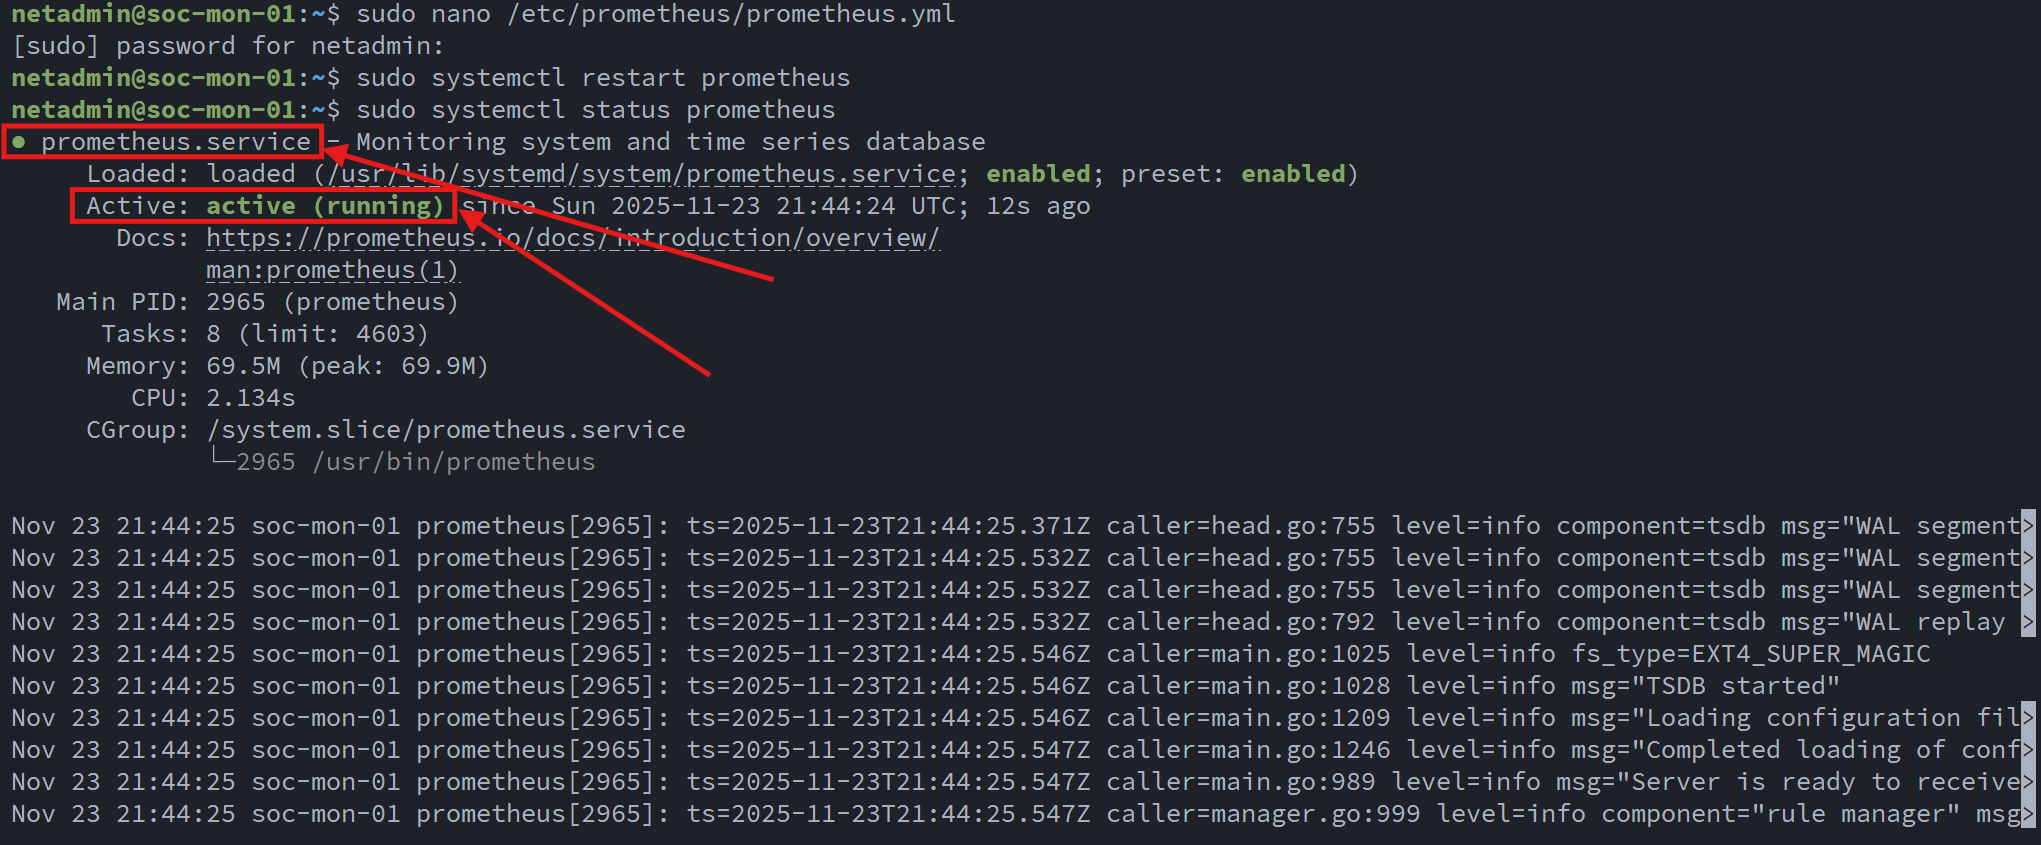
With the agents in place, I installed the Prometheus server on soc-mon-01 and configured it to scrape each system at regular intervals. Below is the relevant section of the Prometheus configuration:
scrape_configs:
  # Scrape Prometheus itself
  - job_name: 'prometheus'
    static_configs:
      - targets: ['localhost:9090']

  # SOC-MON-01 (monitoring box itself)
  - job_name: 'node_soc-mon-01'
    static_configs:
      - targets: ['localhost:9100']
        labels:
          host: 'SOC-MON-01'
          role: 'monitoring'

  # OpenSearch node
  - job_name: 'node_soc-os-01'
    static_configs:
      - targets: ['10.0.20.180:9100']
        labels:
          host: 'SOC-OS-01'
          role: 'opensearch'

  # Wazuh manager/dashboard node
  - job_name: 'node_soc-waz-01'
    static_configs:
      - targets: ['10.0.20.181:9100']
        labels:
          host: 'SOC-WAZ-01'
          role: 'wazuh'

  # Suricata sensor
  - job_name: 'node_soc-sur-01'
    static_configs:
      - targets: ['10.0.20.182:9100']
        labels:
          host: 'SOC-SUR-01'
          role: 'ids'
          sensor: 'suricata'

  # Zeek sensor
  - job_name: 'node_soc-zeek-01'
    static_configs:
      - targets: ['10.0.20.183:9100']
        labels:
          host: 'SOC-ZEEK-01'
          role: 'ids'
          sensor: 'zeek'
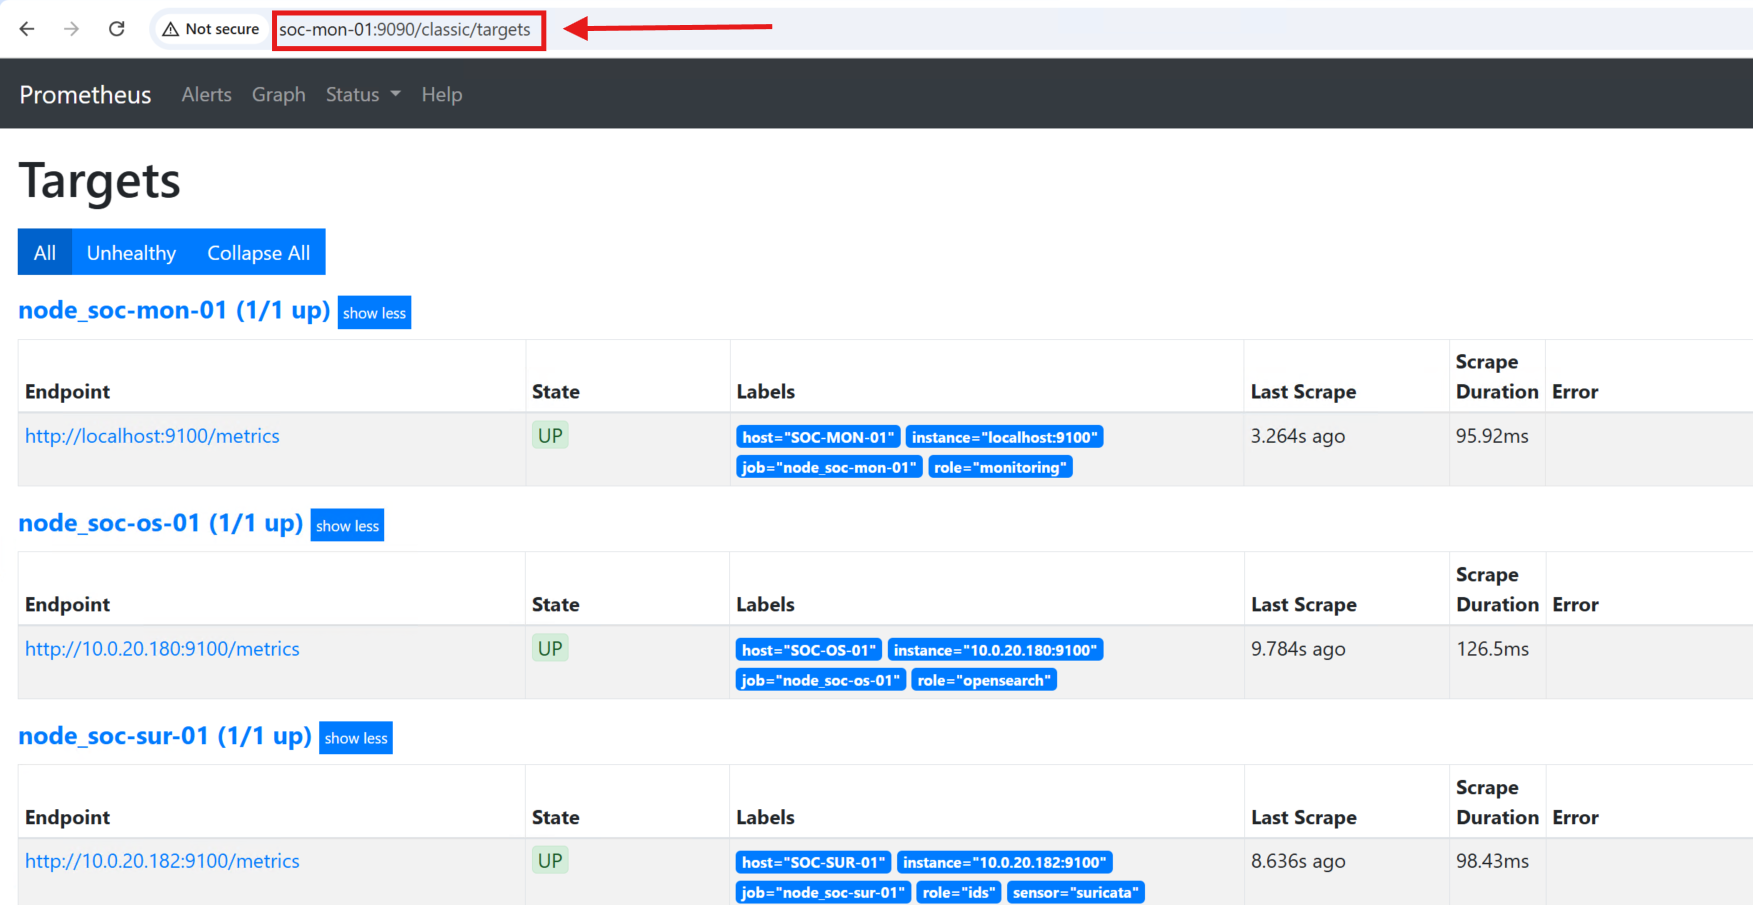
Once the configuration was loaded, I brought up the Prometheus Web UI and verified that each scrape job was active and returning metrics:
Next, I installed Grafana to visualize data collected by Prometheus:
# Grafana GPG key
wget -q -O - https://packages.grafana.com/gpg.key | sudo apt-key add -

# Repo
echo "deb https://packages.grafana.com/oss/deb stable main" \
  | sudo tee /etc/apt/sources.list.d/grafana.list

sudo apt-get update
sudo apt-get install -y grafana

sudo systemctl enable --now grafana-server
sudo systemctl status grafana-server
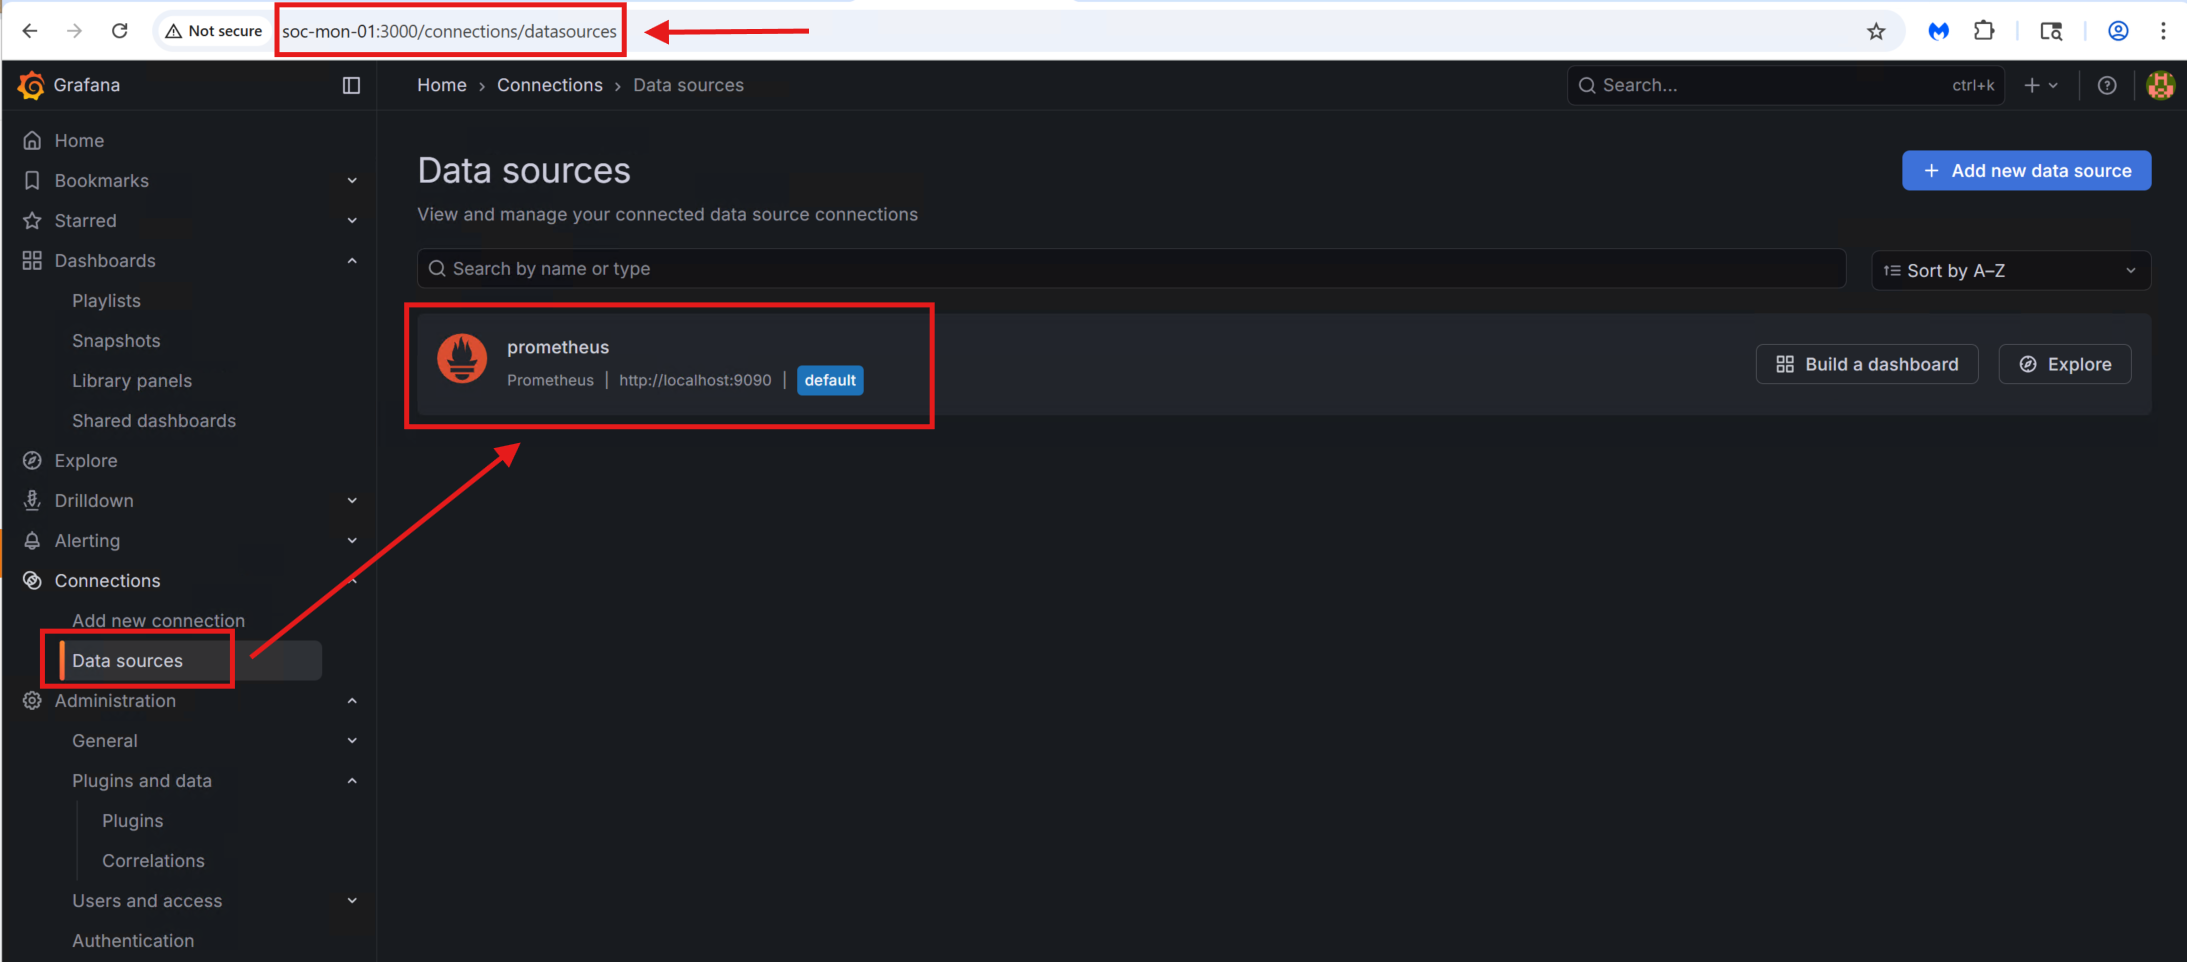
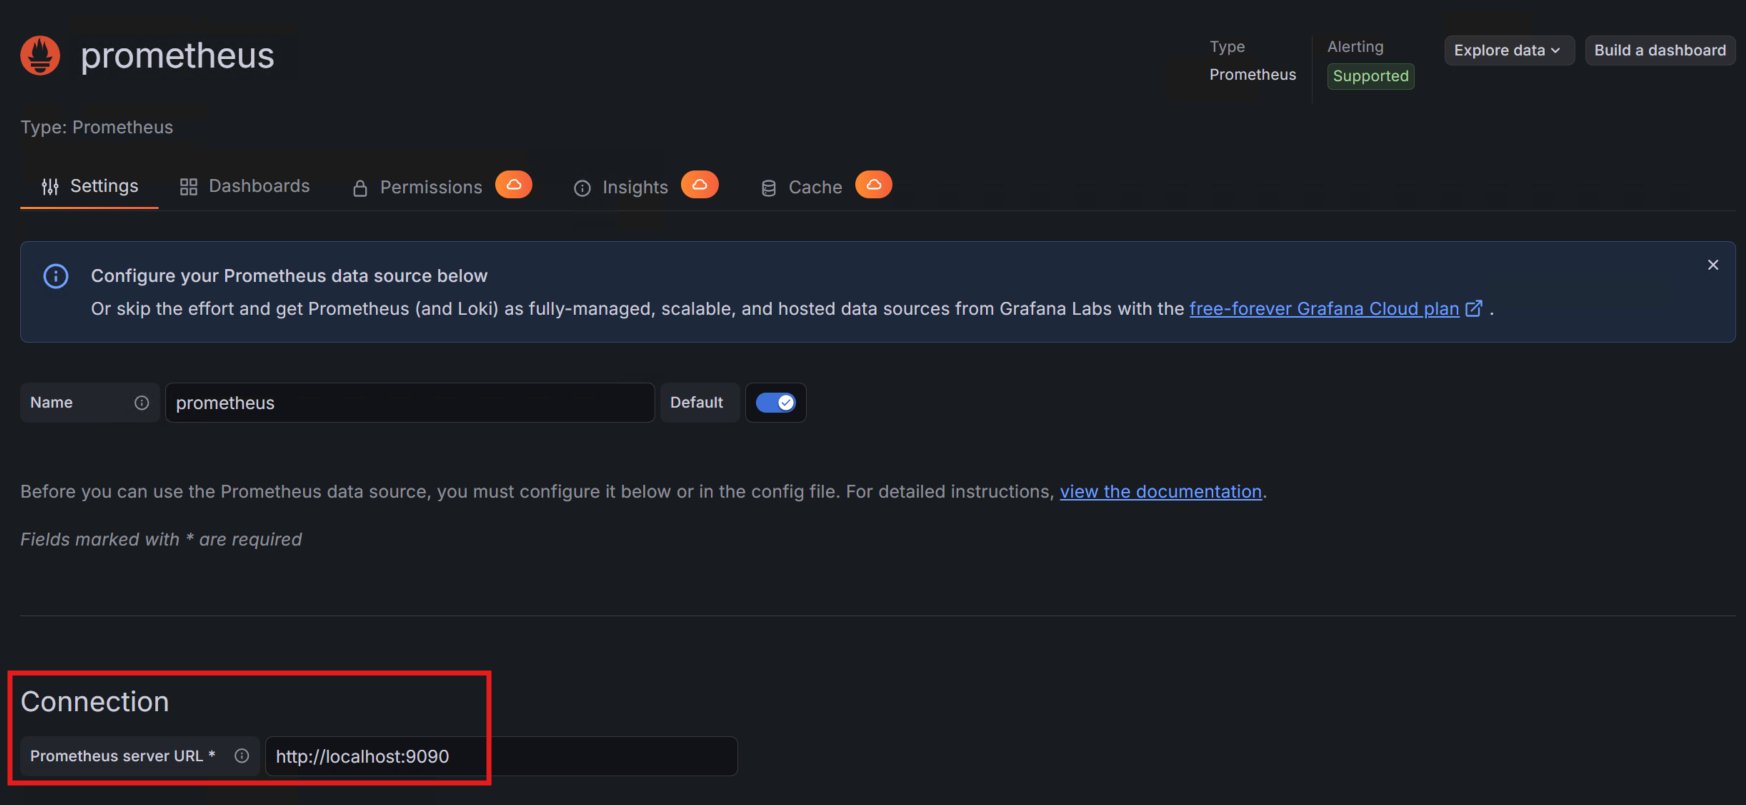
After the installation, I accessed the Grafana UI at http://soc-mon-01:3000 and added Prometheus as a data source.
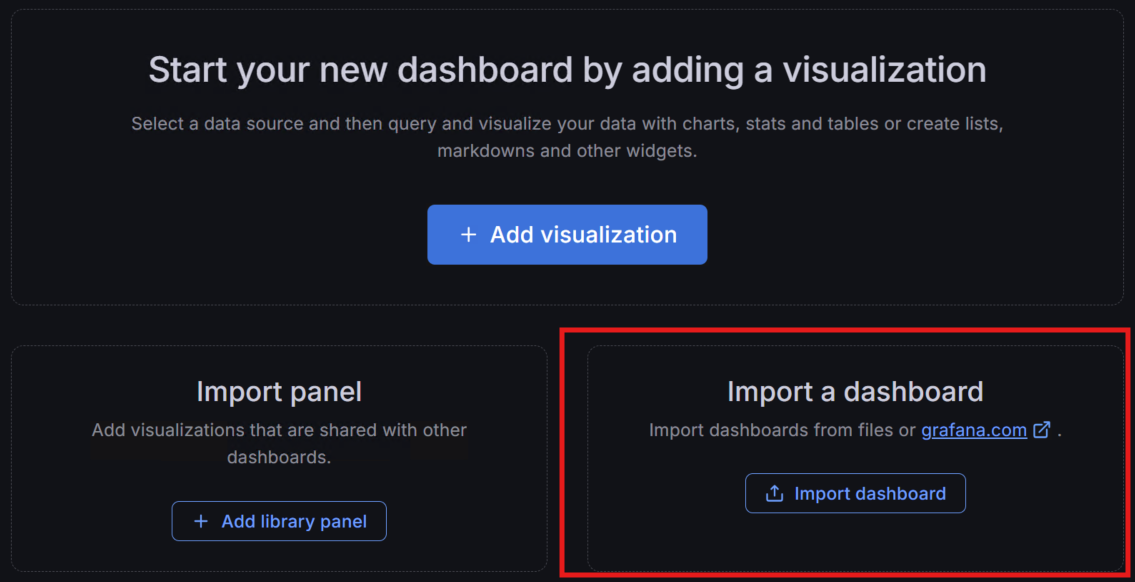
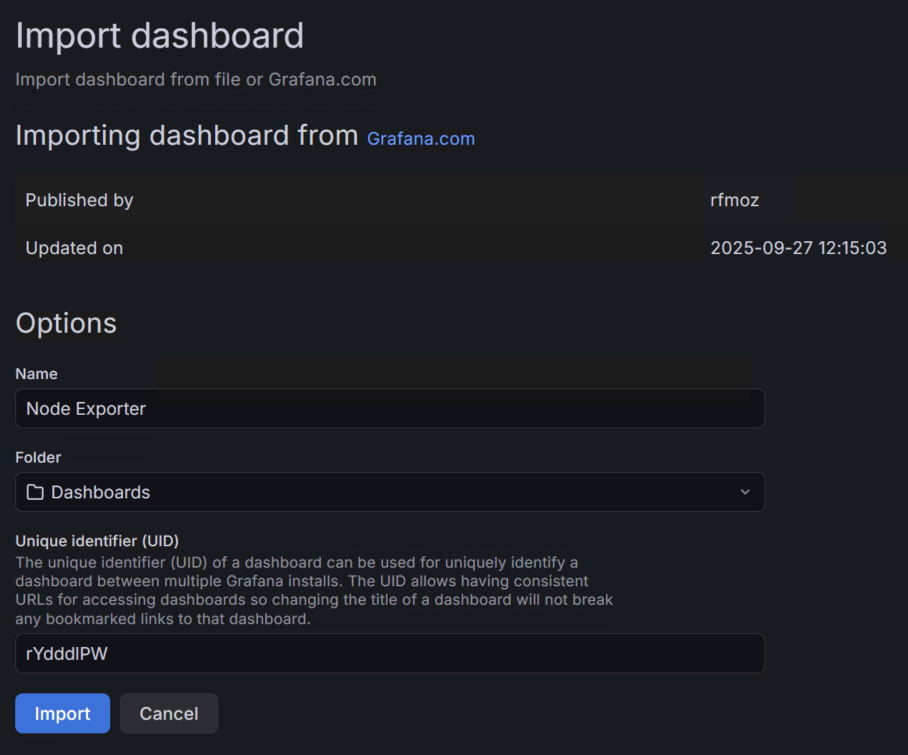
With the data source configured, I imported a pre-built dashboard—Grafana Dashboard ID 1860—which provides a comprehensive overview of system performance across all SOC servers.
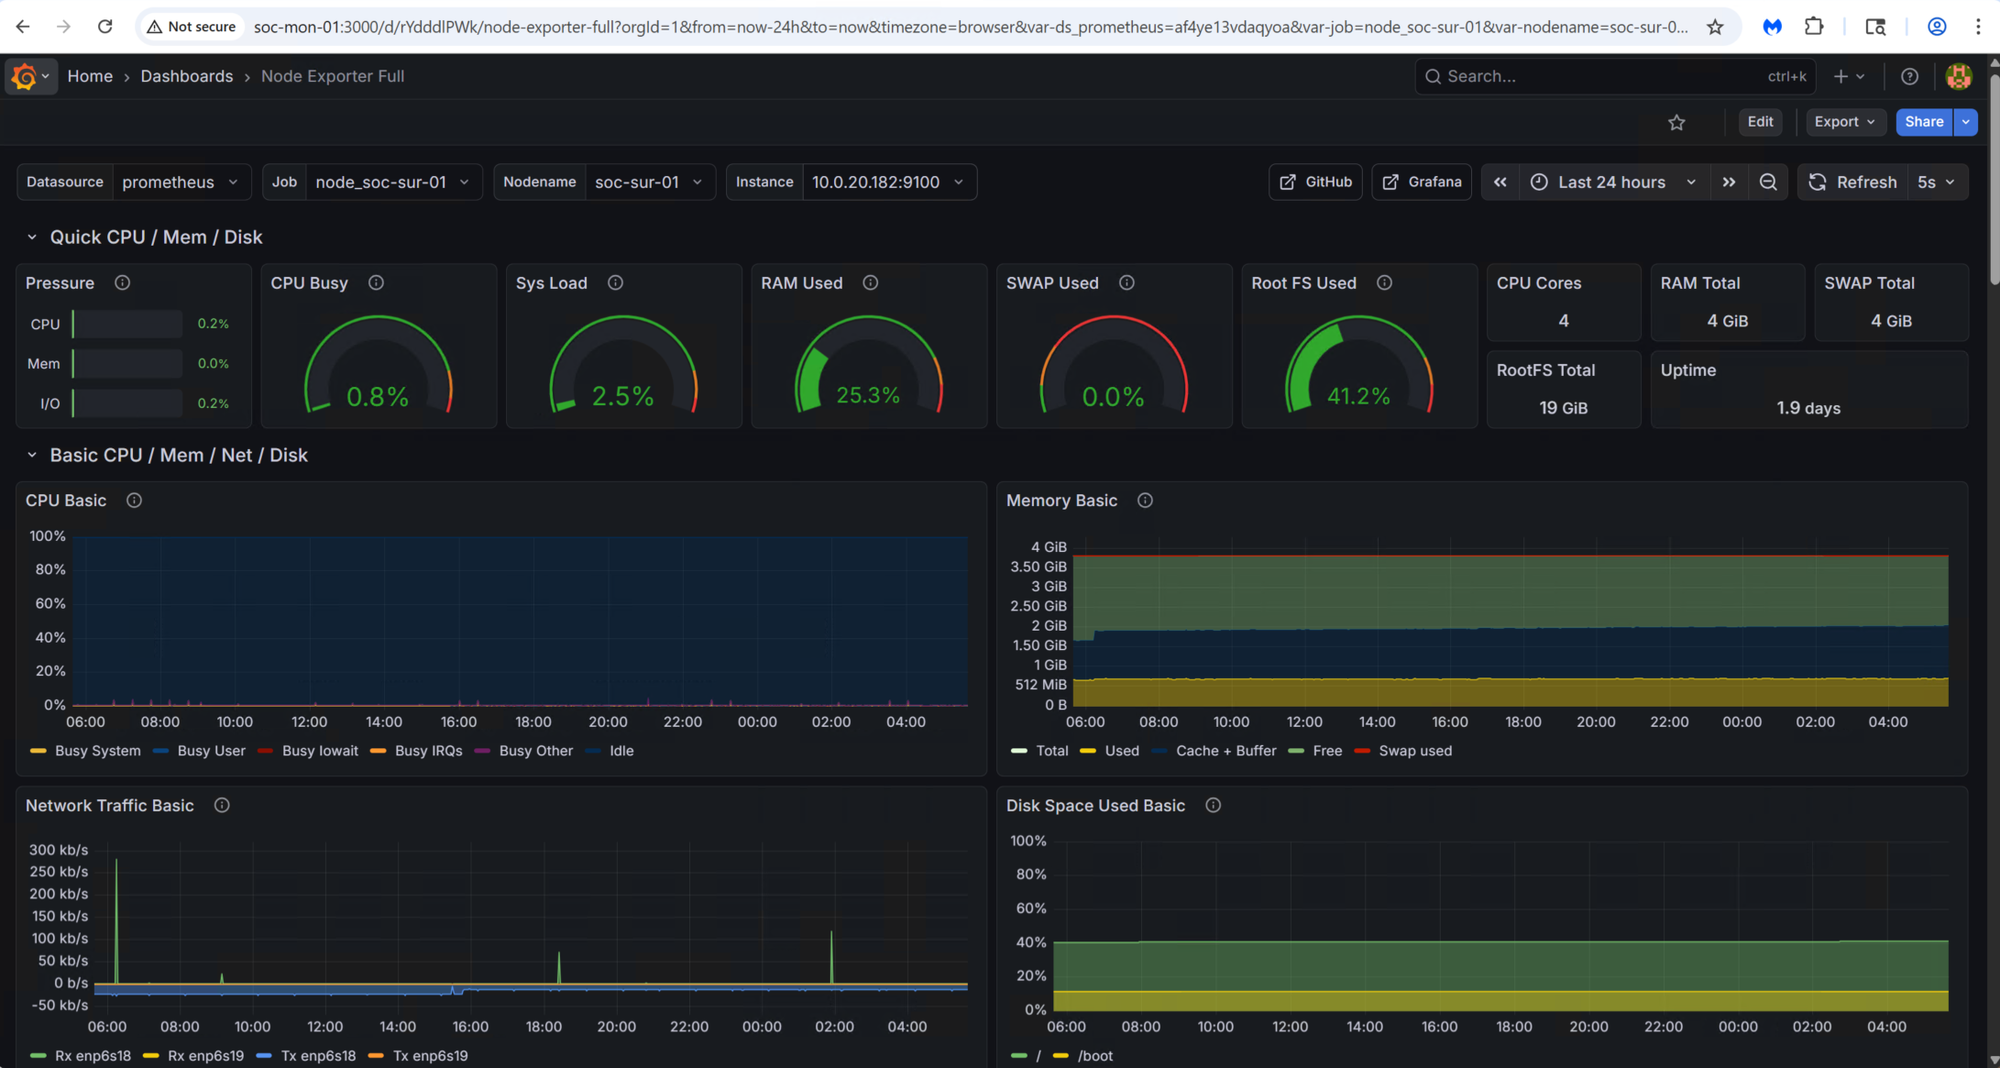
The prebuilt dashboard offers a broad set of health metrics, including CPU, memory, network throughput, process activity, filesystem usage, and more. It serves as a solid foundation for ongoing monitoring:
In the coming weeks, I plan to dive deeper into Grafana and begin building custom security-focused dashboards, leveraging Wazuh alert data, OpenSearch indexes, and real-time IDS telemetry from Suricata and Zeek.
ntopng – Network Flow Analytics
The final component of the SOC stack is network traffic monitoring with ntopng. ntopng is a high-performance, web-based traffic analysis and flow-monitoring platform that provides deep visibility into what’s happening on the network in real time. It analyzes mirrored/SPAN traffic or flow exports and surfaces insights such as bandwidth usage, active hosts, applications, protocols, conversations, and potential anomalies. Its intuitive dashboard makes it an excellent tool for SOC teams and network engineers who need to understand activity “on the wire.”
To begin, I installed the ntopng packages:
# Add ntop repository GPG key
wget https://packages.ntop.org/apt/ntop.key
sudo gpg --yes --dearmor -o /usr/share/keyrings/ntop.gpg ntop.key

# Add ntop repo (noble = 24.04 codename)
echo "deb [signed-by=/usr/share/keyrings/ntop.gpg] https://packages.ntop.org/apt/ubuntu/ noble main" | \
  sudo tee /etc/apt/sources.list.d/ntop.list

sudo apt update

# Install ntopng (community edition is fine for lab)
sudo apt install -y ntopng
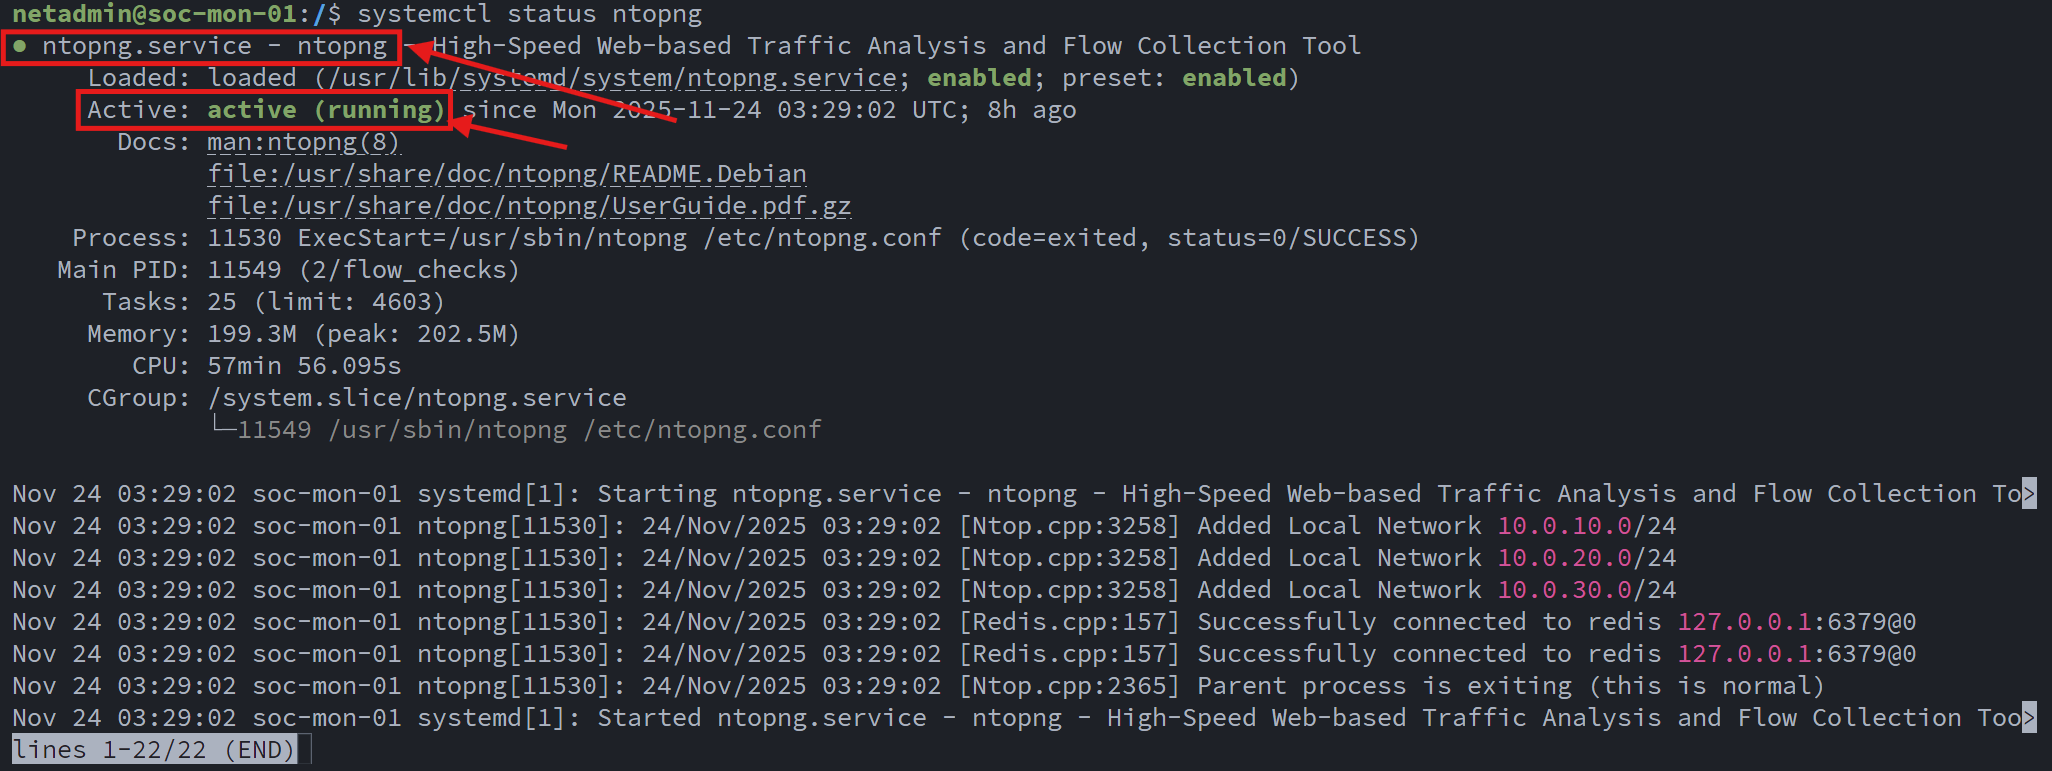
After installation, I verified that the ntopng service was running correctly:
Since ntopng relies on live packet capture, I configured the core switch’s SPAN port to mirror network traffic to the dedicated NIC on the monitoring VM:
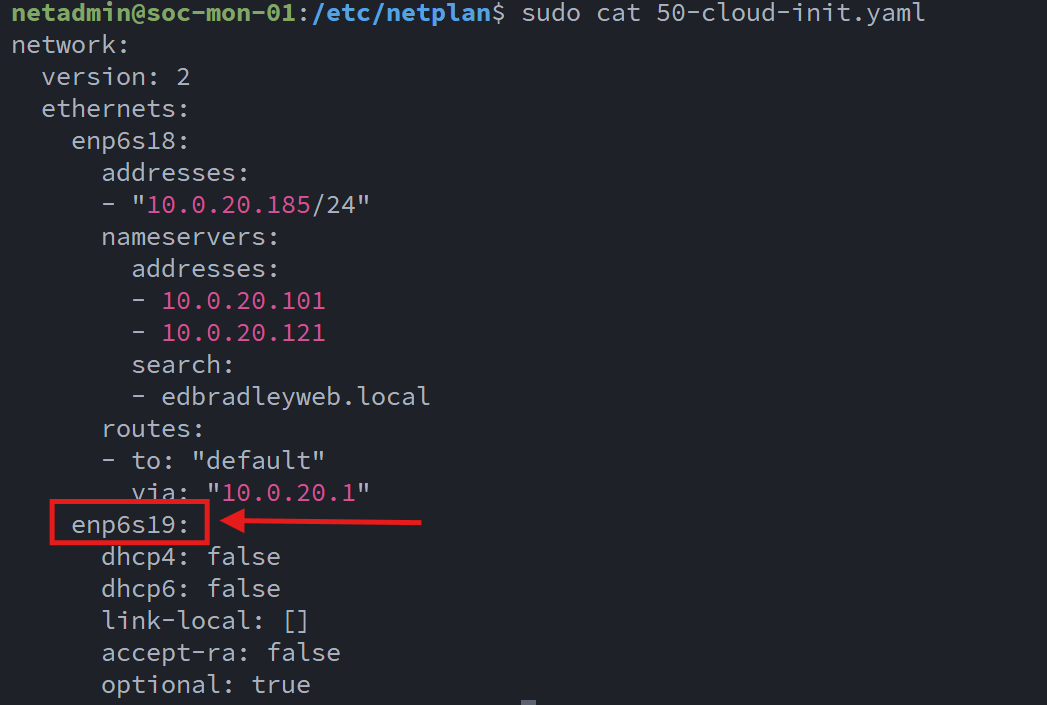
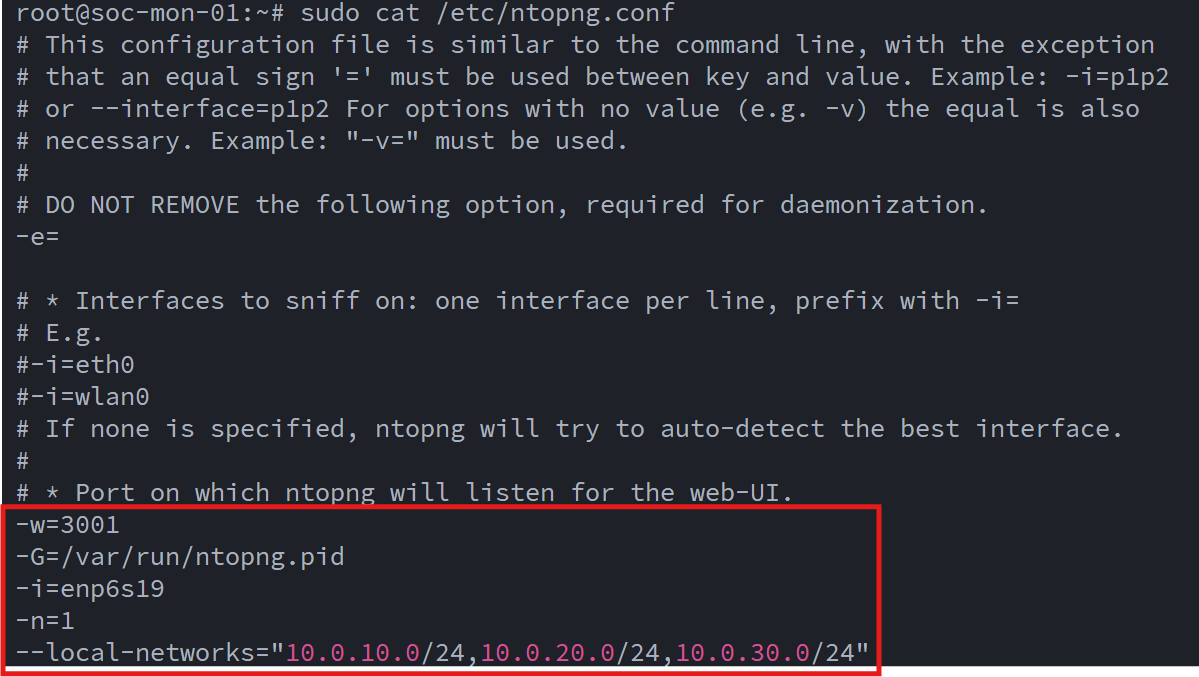
With the mirrored traffic flowing in, I proceeded to configure ntopng for my lab network layout and interface assignments:
Once the initial configuration was complete, I accessed the ntopng Web UI (http//soc-mon-01:3000):
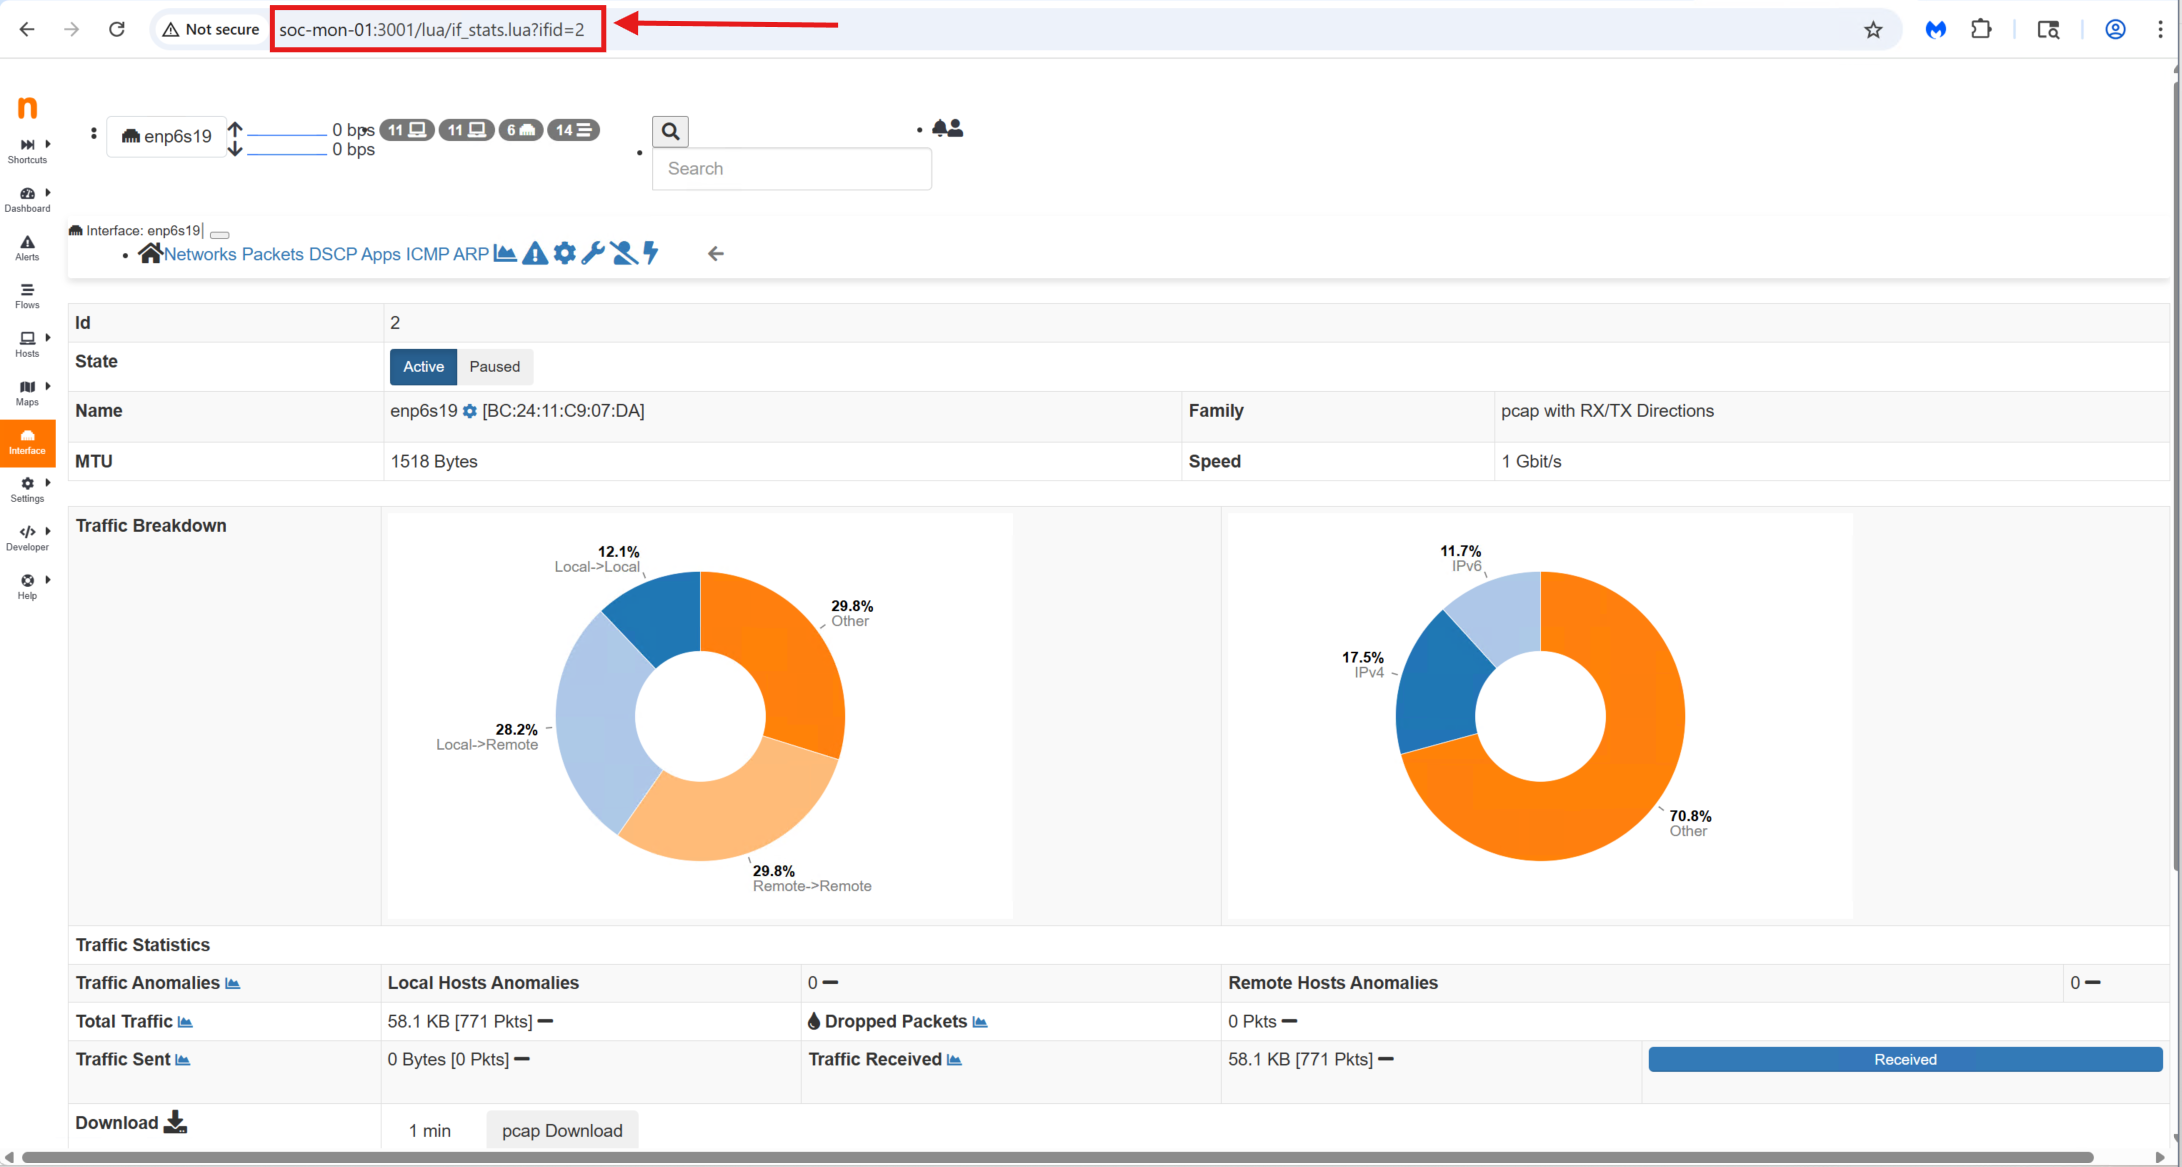
Out of the box, it immediately began displaying live traffic, top talkers, protocol breakdowns, and detailed flow statistics. Even with a default setup, ntopng provides a surprisingly rich amount of visibility.
In the coming weeks, I’ll be exploring its advanced features—such as flow alerts, host reputation checks, Layer-7 application detection, and integration with Suricata and Zeek, to further enhance the security monitoring capabilities of the SOC stack.
🧩 Wrap Up
With every core component now deployed—OpenSearch, Wazuh, Suricata, Zeek, Prometheus, Grafana, and ntopng—the Mini SOC has evolved into a fully functional, enterprise-style security monitoring platform running entirely on a single Proxmox host. This build-out brought its share of challenges, from tuning data pipelines to troubleshooting index mappings and packet-capture interfaces, but each hurdle offered valuable hands-on insight into how real-world SOC tools operate behind the scenes. What now exists is a deeply integrated ecosystem capable of ingesting logs, correlating security events, inspecting network traffic, analyzing protocols, monitoring system health, and visualizing everything in a unified analyst-friendly workflow. In the next phase, I’ll focus on tuning detection rules, deploying agents across additional endpoints, enriching the data models, and building dashboards that turn this architecture into a powerful threat-hunting and learning environment.
The foundation is complete, now the fun part begins!